QUALITY IS IN THE EYE OF THE BEHOLDER
Let’s revisit our favorite example, plucky Lisa and her Lemonade Stand, for a better grasp on how to visualize metrics.
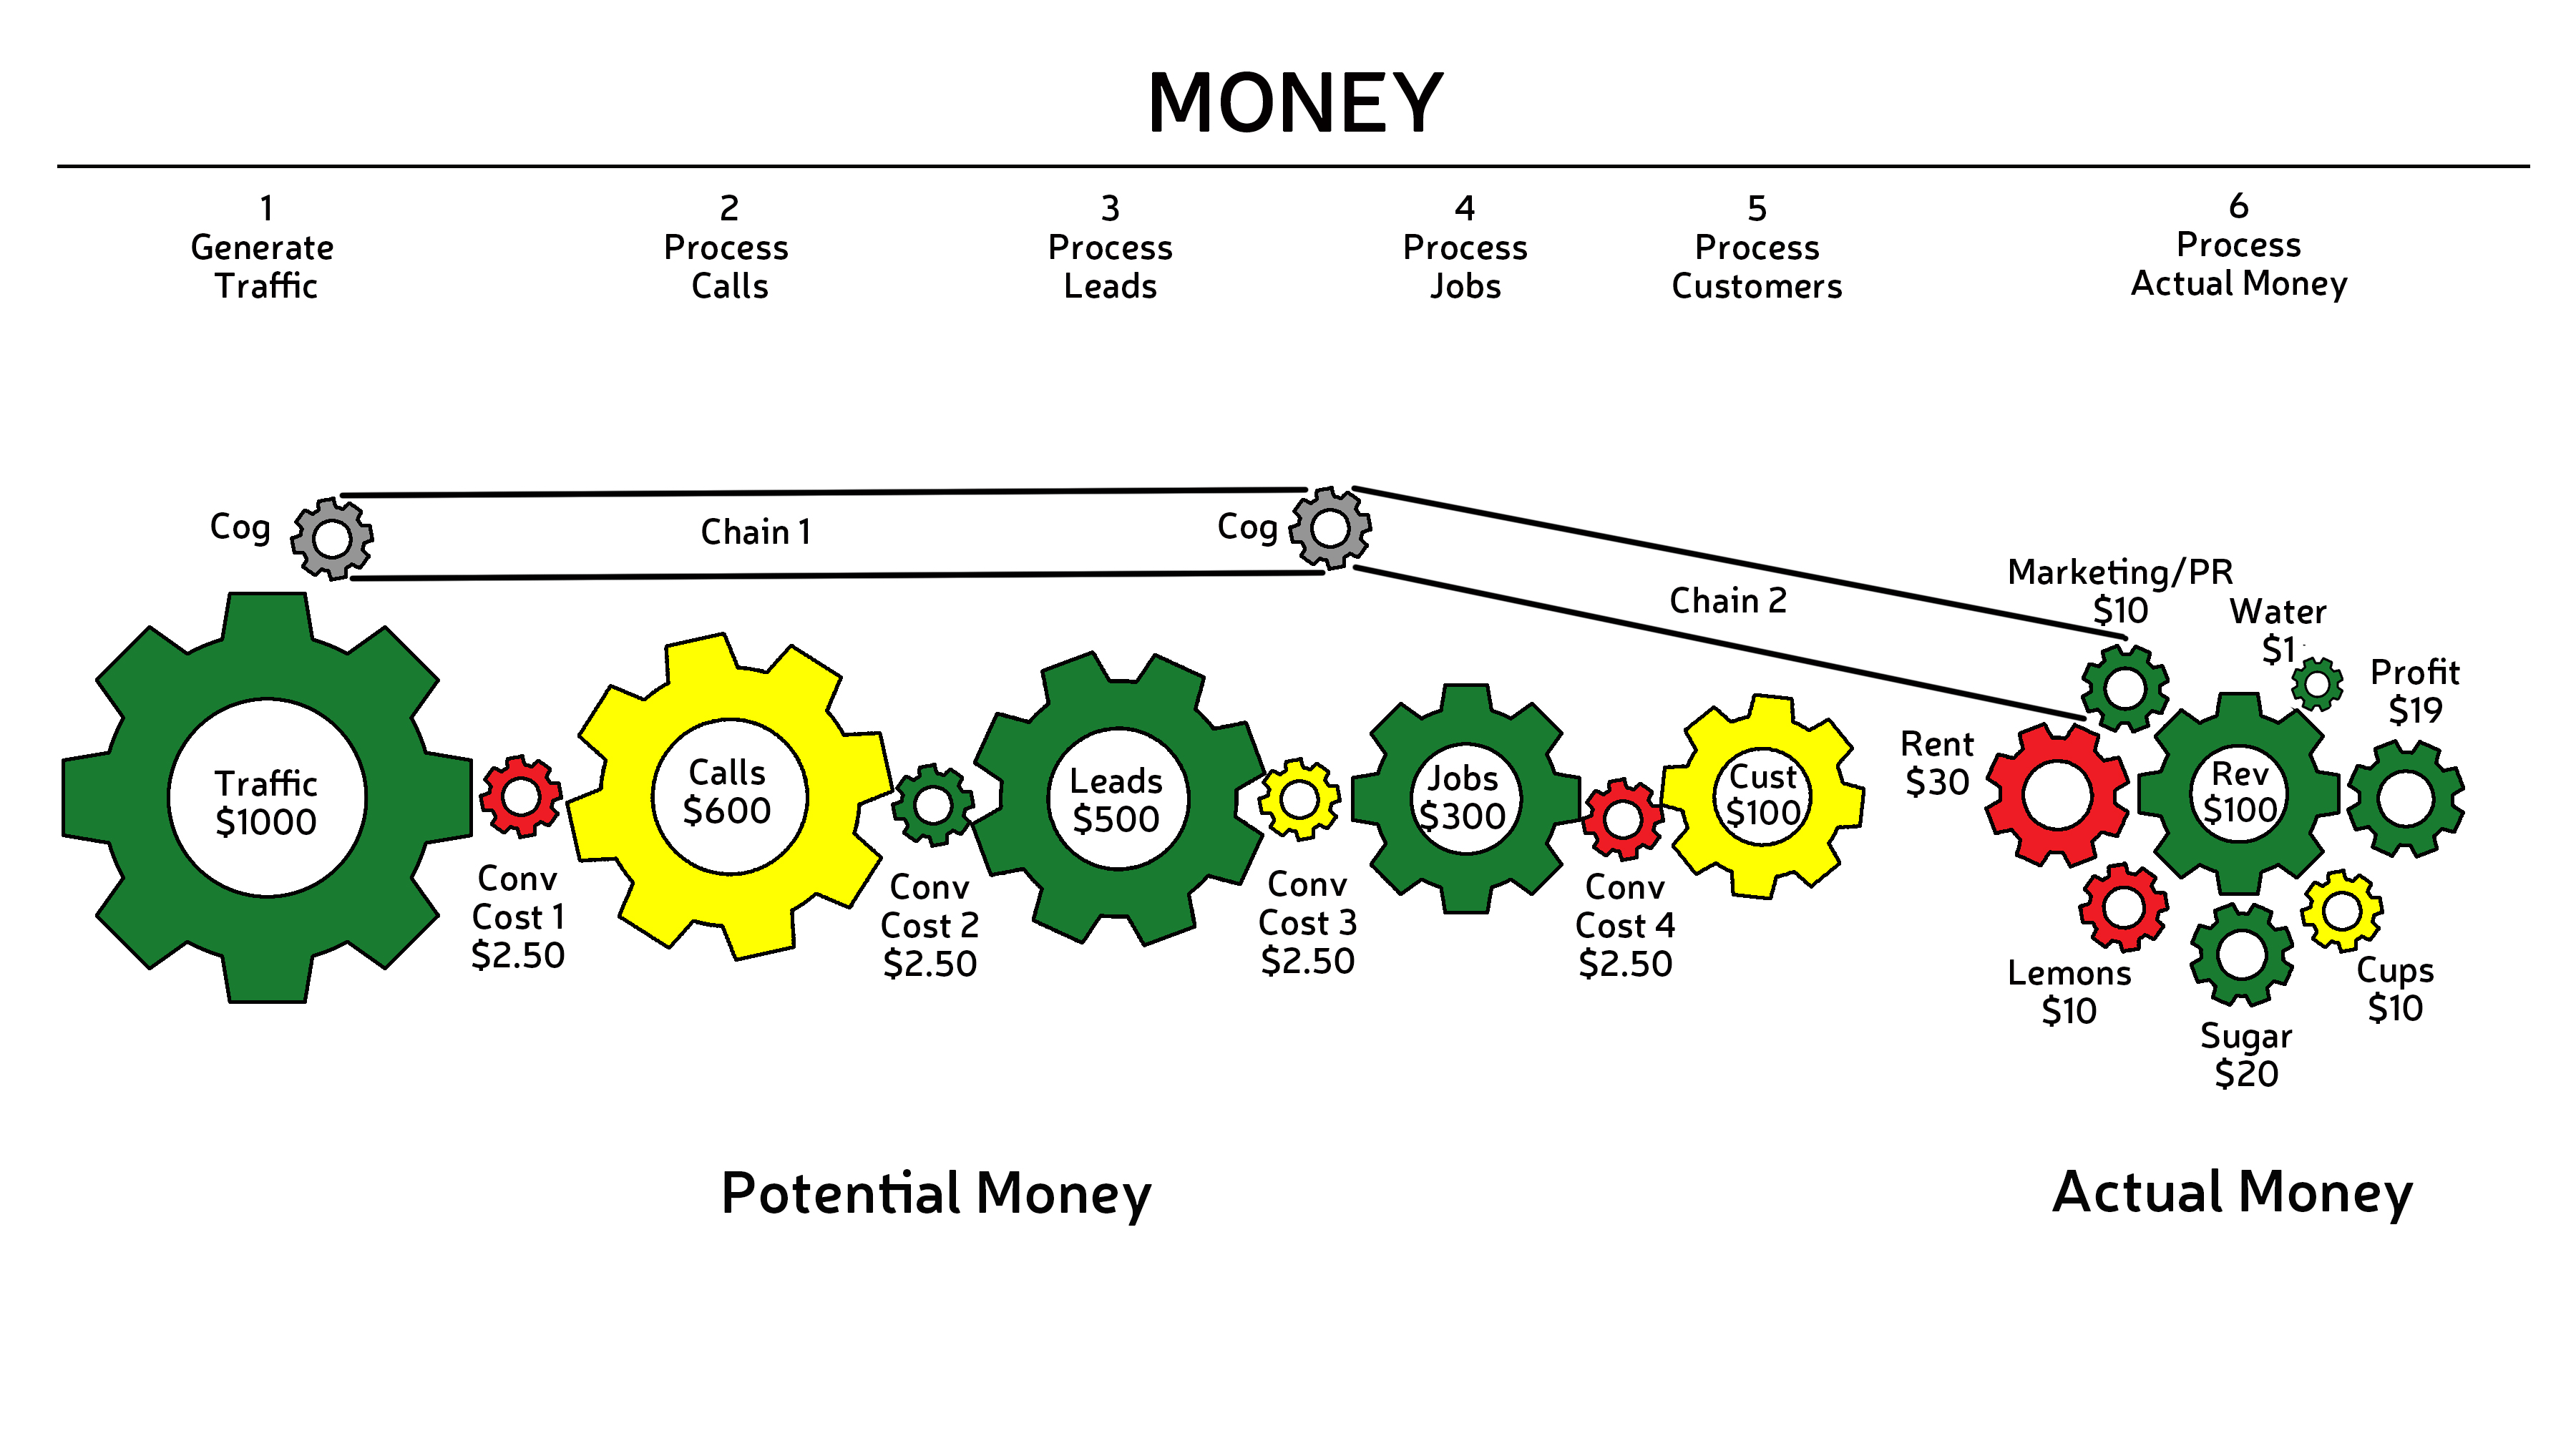
Here again is the final money model we drew up for Lisa’s business in Unit 3. It shows the relative ratios of potential money as it moves through the sales funnel on the left and actual money accounted for by income statements on the right.
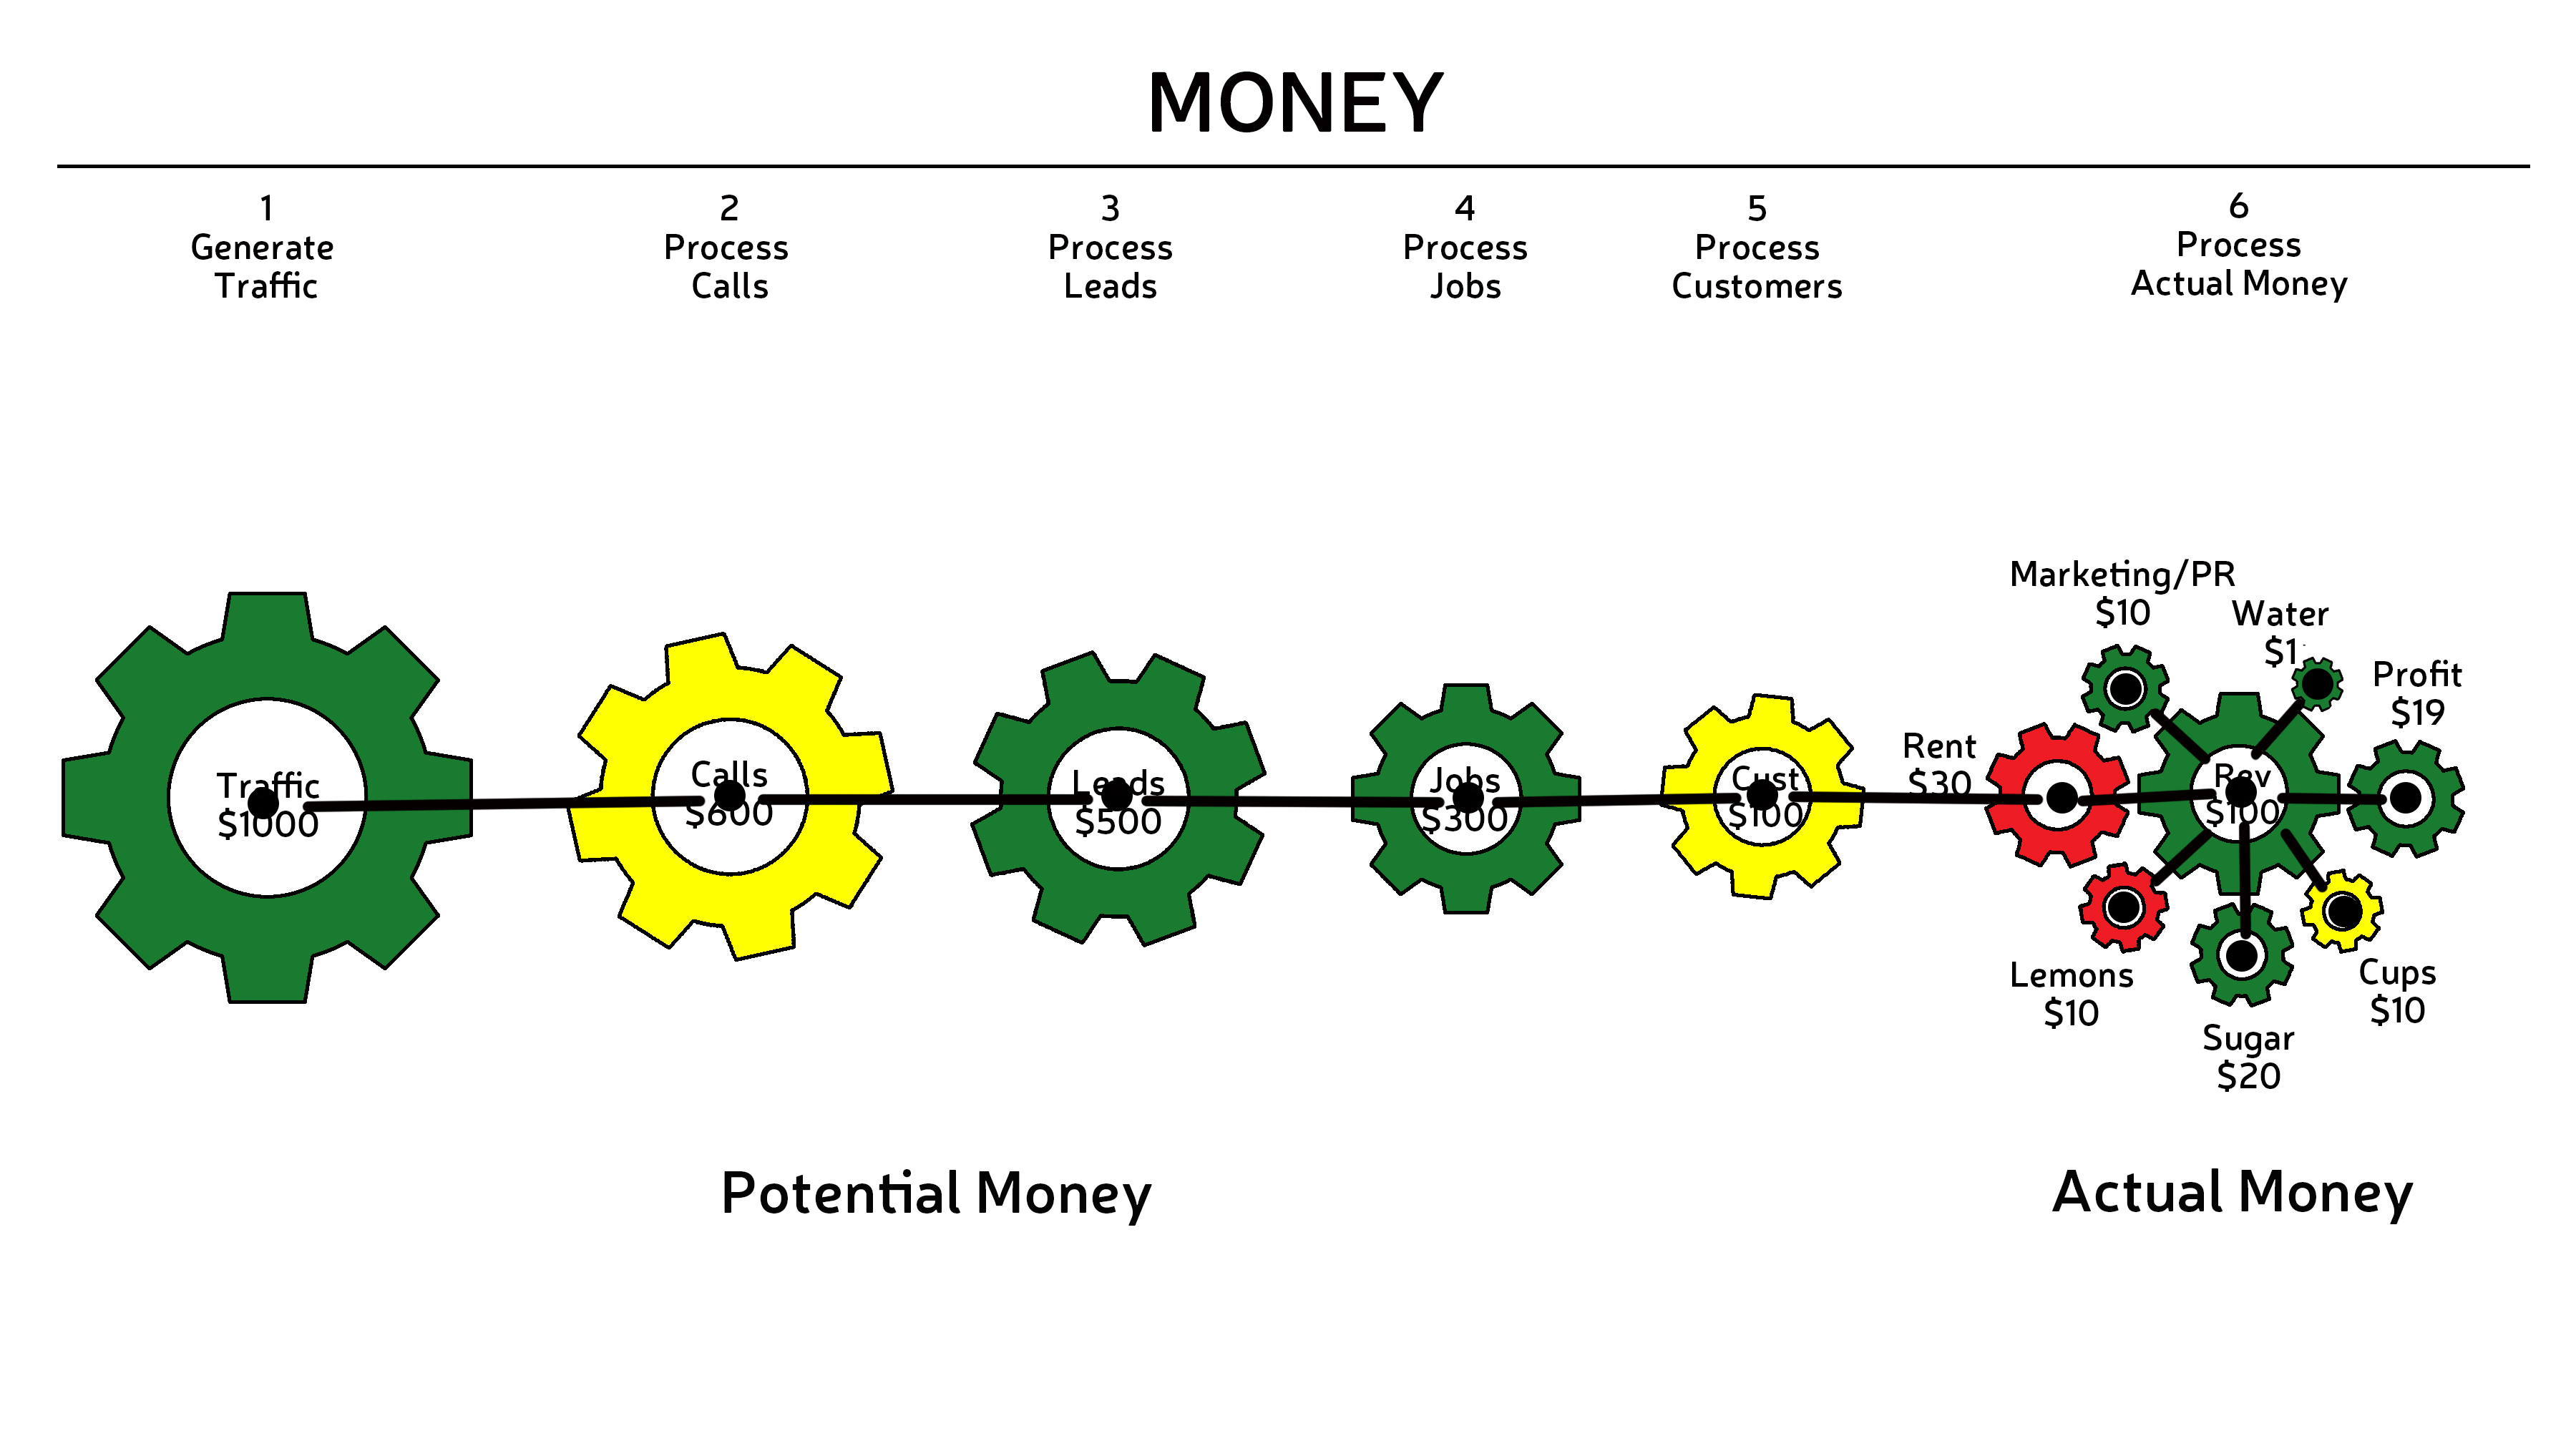
To extend the money model into a metrics model you first need to map out a baseline through select performance points in the system. In other words, draw a dot at the center of each gear and connect the dots.
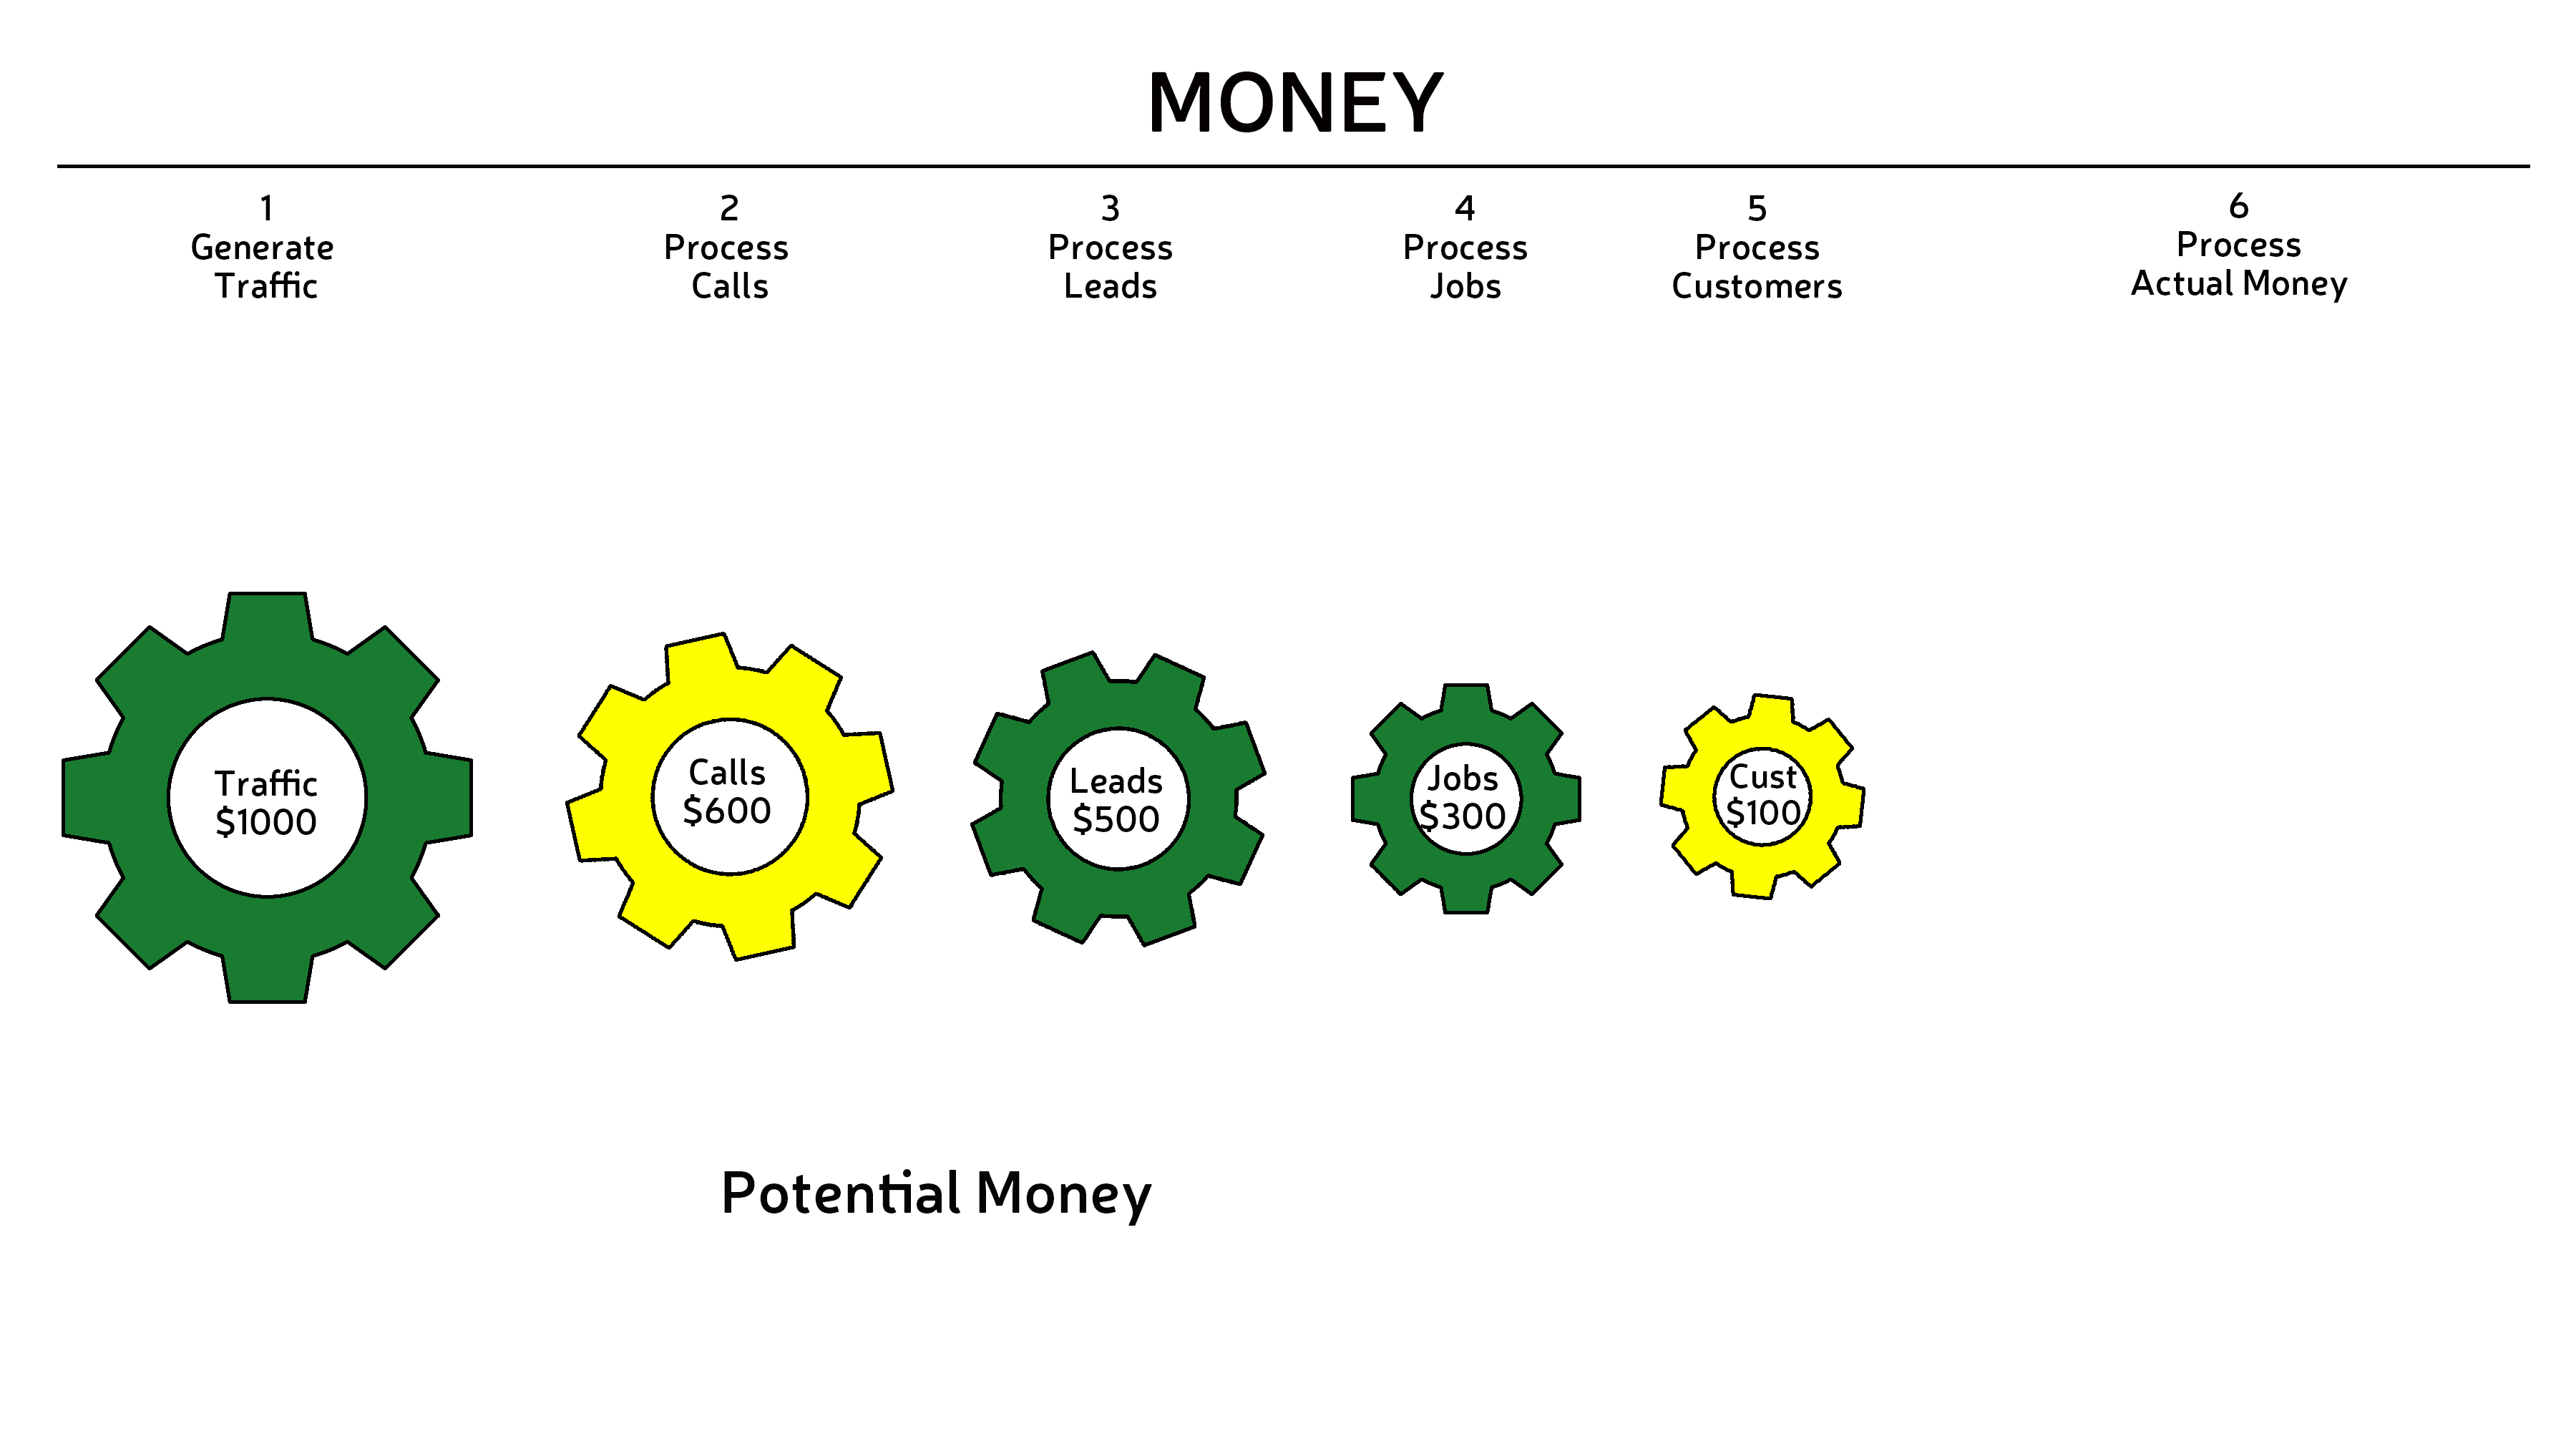
Then, remove the gears…
 You’re left with a map of the locations to measure. Easy enough. But now comes the hard part: figuring out what to measure. For each line in the model, I need to decide: What am I measuring here?
Think about that car engine and all the performance points you could measure in a quality test: fuel consumption per mile, monthly burn rate for oil, how fast the pistons pump at various speeds, and so on.
Likewise, countless points in your business engine can be measured in countless ways. One of a business owner’s great challenges is discerning which metrics are critical to performance and which aren’t.
For Lisa’s Lemonade Stand, we’ll consider two types of metrics, one for the Sales Funnel and another for the Income Statement.
OBJECTIVE MEASUREMENTS
A quick glance at Lisa’s money model tells us that she’s losing money from one gear to the next. If she weren’t, the ratio between each set of gears in the funnel would be 1:1. Visually speaking, that would mean all the gears would be the same size. Clearly, they’re not.
 So, we want to assess the progress from gear to gear in terms of metrics to gauge how well Lisa is converting traffic to calls, calls to leads, leads to job, and finally, jobs to customers.
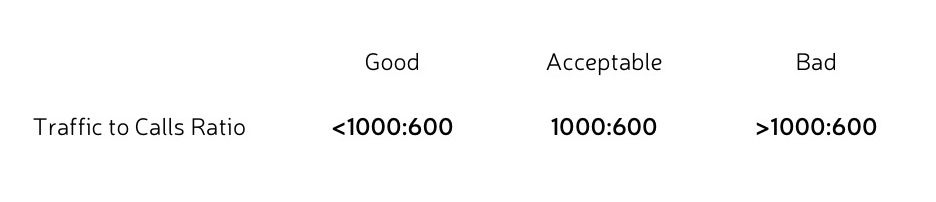
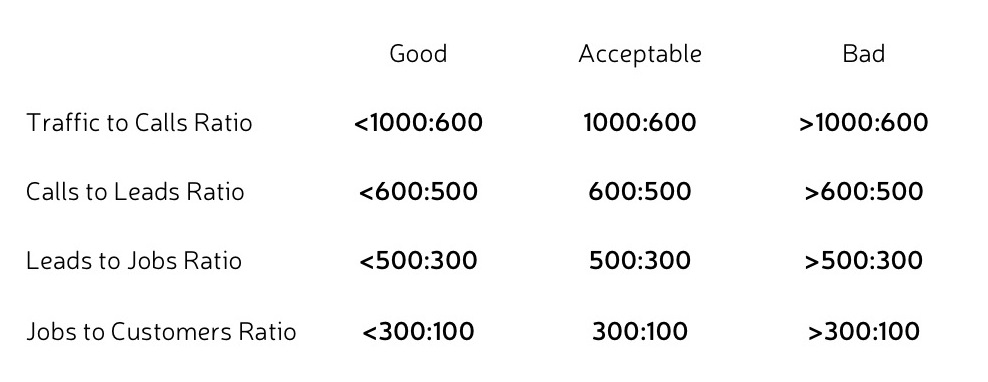
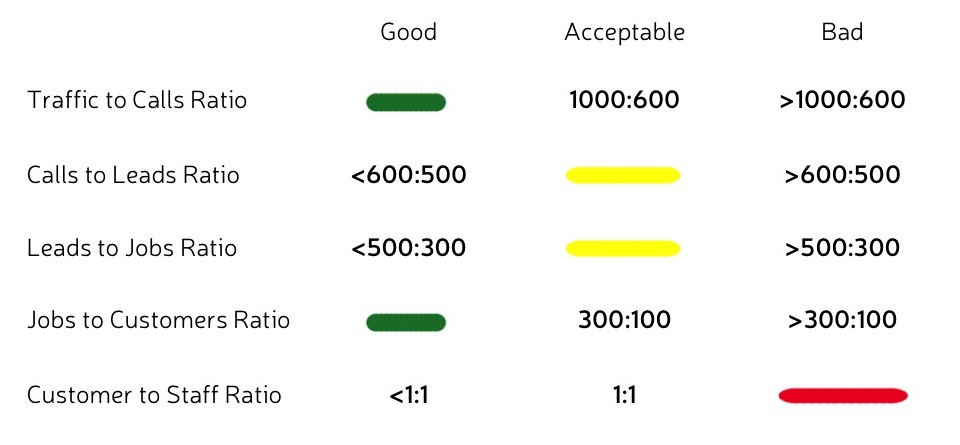
First, we’ll need to establish a high, acceptable, or low performance rating for each metric. For example, let’s say that 10,000 people live in Lisa’s town. Let’s say that 1,000 of her fellow citizens know about the Lemonade Stand through advertising, word of mouth, or first-hand encounter. These 1000 townsfolk are the stand’s traffic. We know Lisa will lose potential customers as they move through the sales funnel, but she could reasonably convert at least 600 of those from traffic to calls. In other words, an acceptable conversion ratio would be 1000:600. The closer the ratio gets to 1:1 the better, so any ratio less than 1000:600 is good. Anything greater is bad.
Now that we’ve determined that, we can take it a step farther and estimate that the acceptable conversion ratio for calls to leads might be 600:500. Greater than that: good. Less bad. ‘Nuff said.
With good, acceptable, and poor ratings established for each of the conversion ratios in the sales funnel, we’re ready to turn the metrics into visual language. Good will be represented by a short green line; acceptable by a medium length yellow line; and bad will be a long red line. (Remember: red=friction—and that’s what we’re on the lookout for here.)
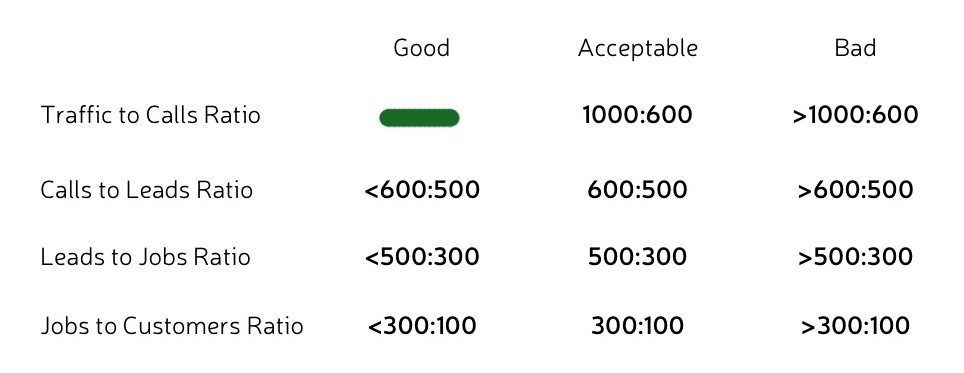
Let’s say that on the day in question, Lisa converted 700 people to calls. That’s good! Short green line.
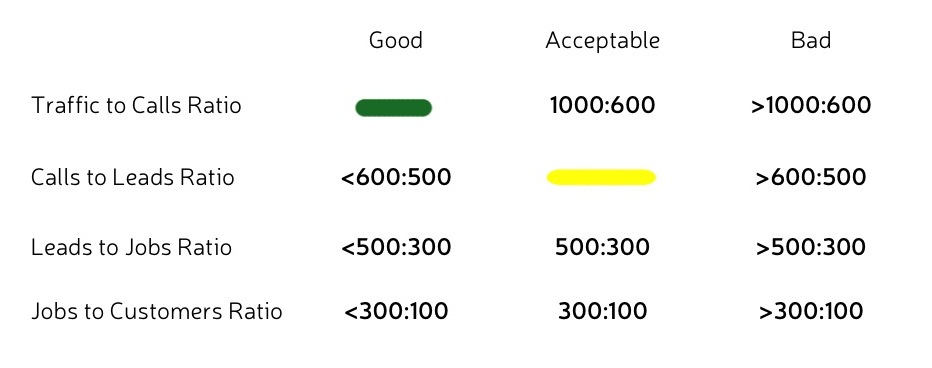
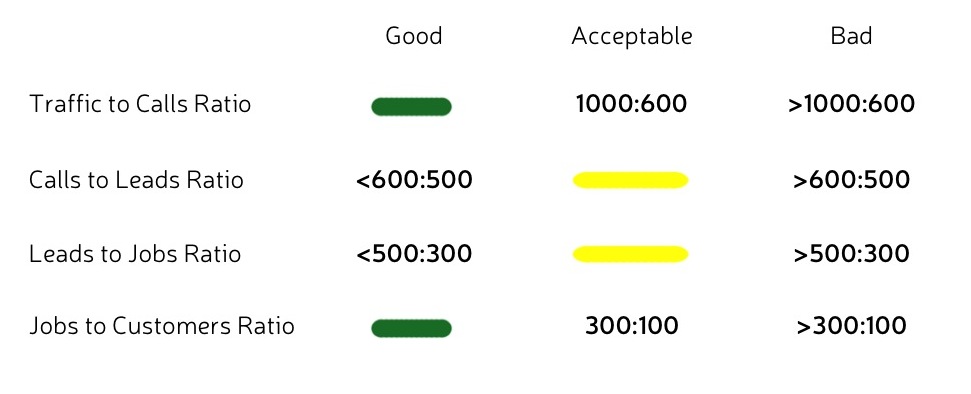
Of that number, she converted 500 calls to leads. Well done, Lisa. Perfectly acceptable. You’ve won this lovely medium yellow line. The number of people she then converted to jobs was also acceptable. The number of people she converted to customers was good.
Let’s consider one more qualitative metric: the ratio of Lisa’s customers to staff. Since Lisa herself is not only the owner of the Lemonade Stand, but also it’s only employee, an acceptable ratio here would be 1:1. In other words, if one staff person—Lisa—can successfully serve one customer at a time, that’s acceptable. Unfortunately for Lisa, on this day, she realized she couldn’t get the customer’s drink AND make their change fast enough to keep the line moving. Some people grew impatient and stormed off. Lisa hired her mom as help. Lisa’s new Customer to Staff ratio? 1:2. Bad. Sorry Lisa’s mom, red line for you.
The final step is replacing all the initial lines in our original metrics map with these new color-coded lines.

SUBJECTIVE MEASUREMENTS
I visualized the metrics associated with Lisa’s Sales Funnel performance by using objective measurements—numbers and ratios. But you can visualize subjective measurements just as easily. Let’s bring our diagnostic firepower to bear on the right side of the model.
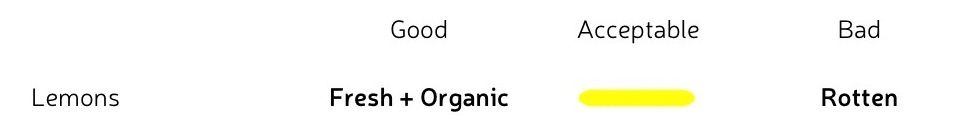
In the sales funnel, Lisa’s metrics indicated quality of performance. Here, where we’re dealing with income statements and actual money, our metrics relate to the quality of the goods or services we spend money on to run our business. So, when assessing Lisa’s lemon purchases, for example, we ask whether the lemons are fresh. Fresh is acceptable. Yellow line. Fresh and organic? That’s high quality citrus, and that’s good. Hence, the line is green. If the lemons are rotten, the quality is poor. Red.
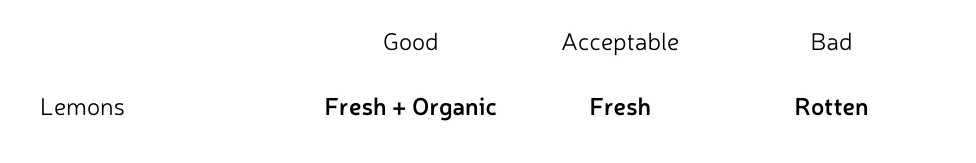
(Lisa’s lemons happen to be fresh but not organic.)
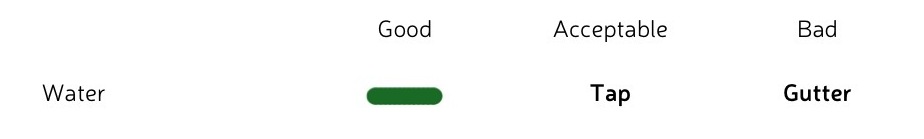
Next we assess the water Lisa uses: tap water (acceptable), filtered water (good), or gutter water (bad).
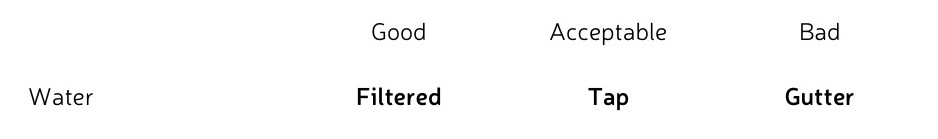
Lisa uses filtered water, you’ll be relieved to know.
We continue until we’ve compiled our metrics for each of the remaining elements and translated them into color-coded lines. Then we plug them into their respective places on the map. Voila! A complete visual model of the metrics associated with Lisa’s business engine.
Now… What does it say about the performance of her engine?
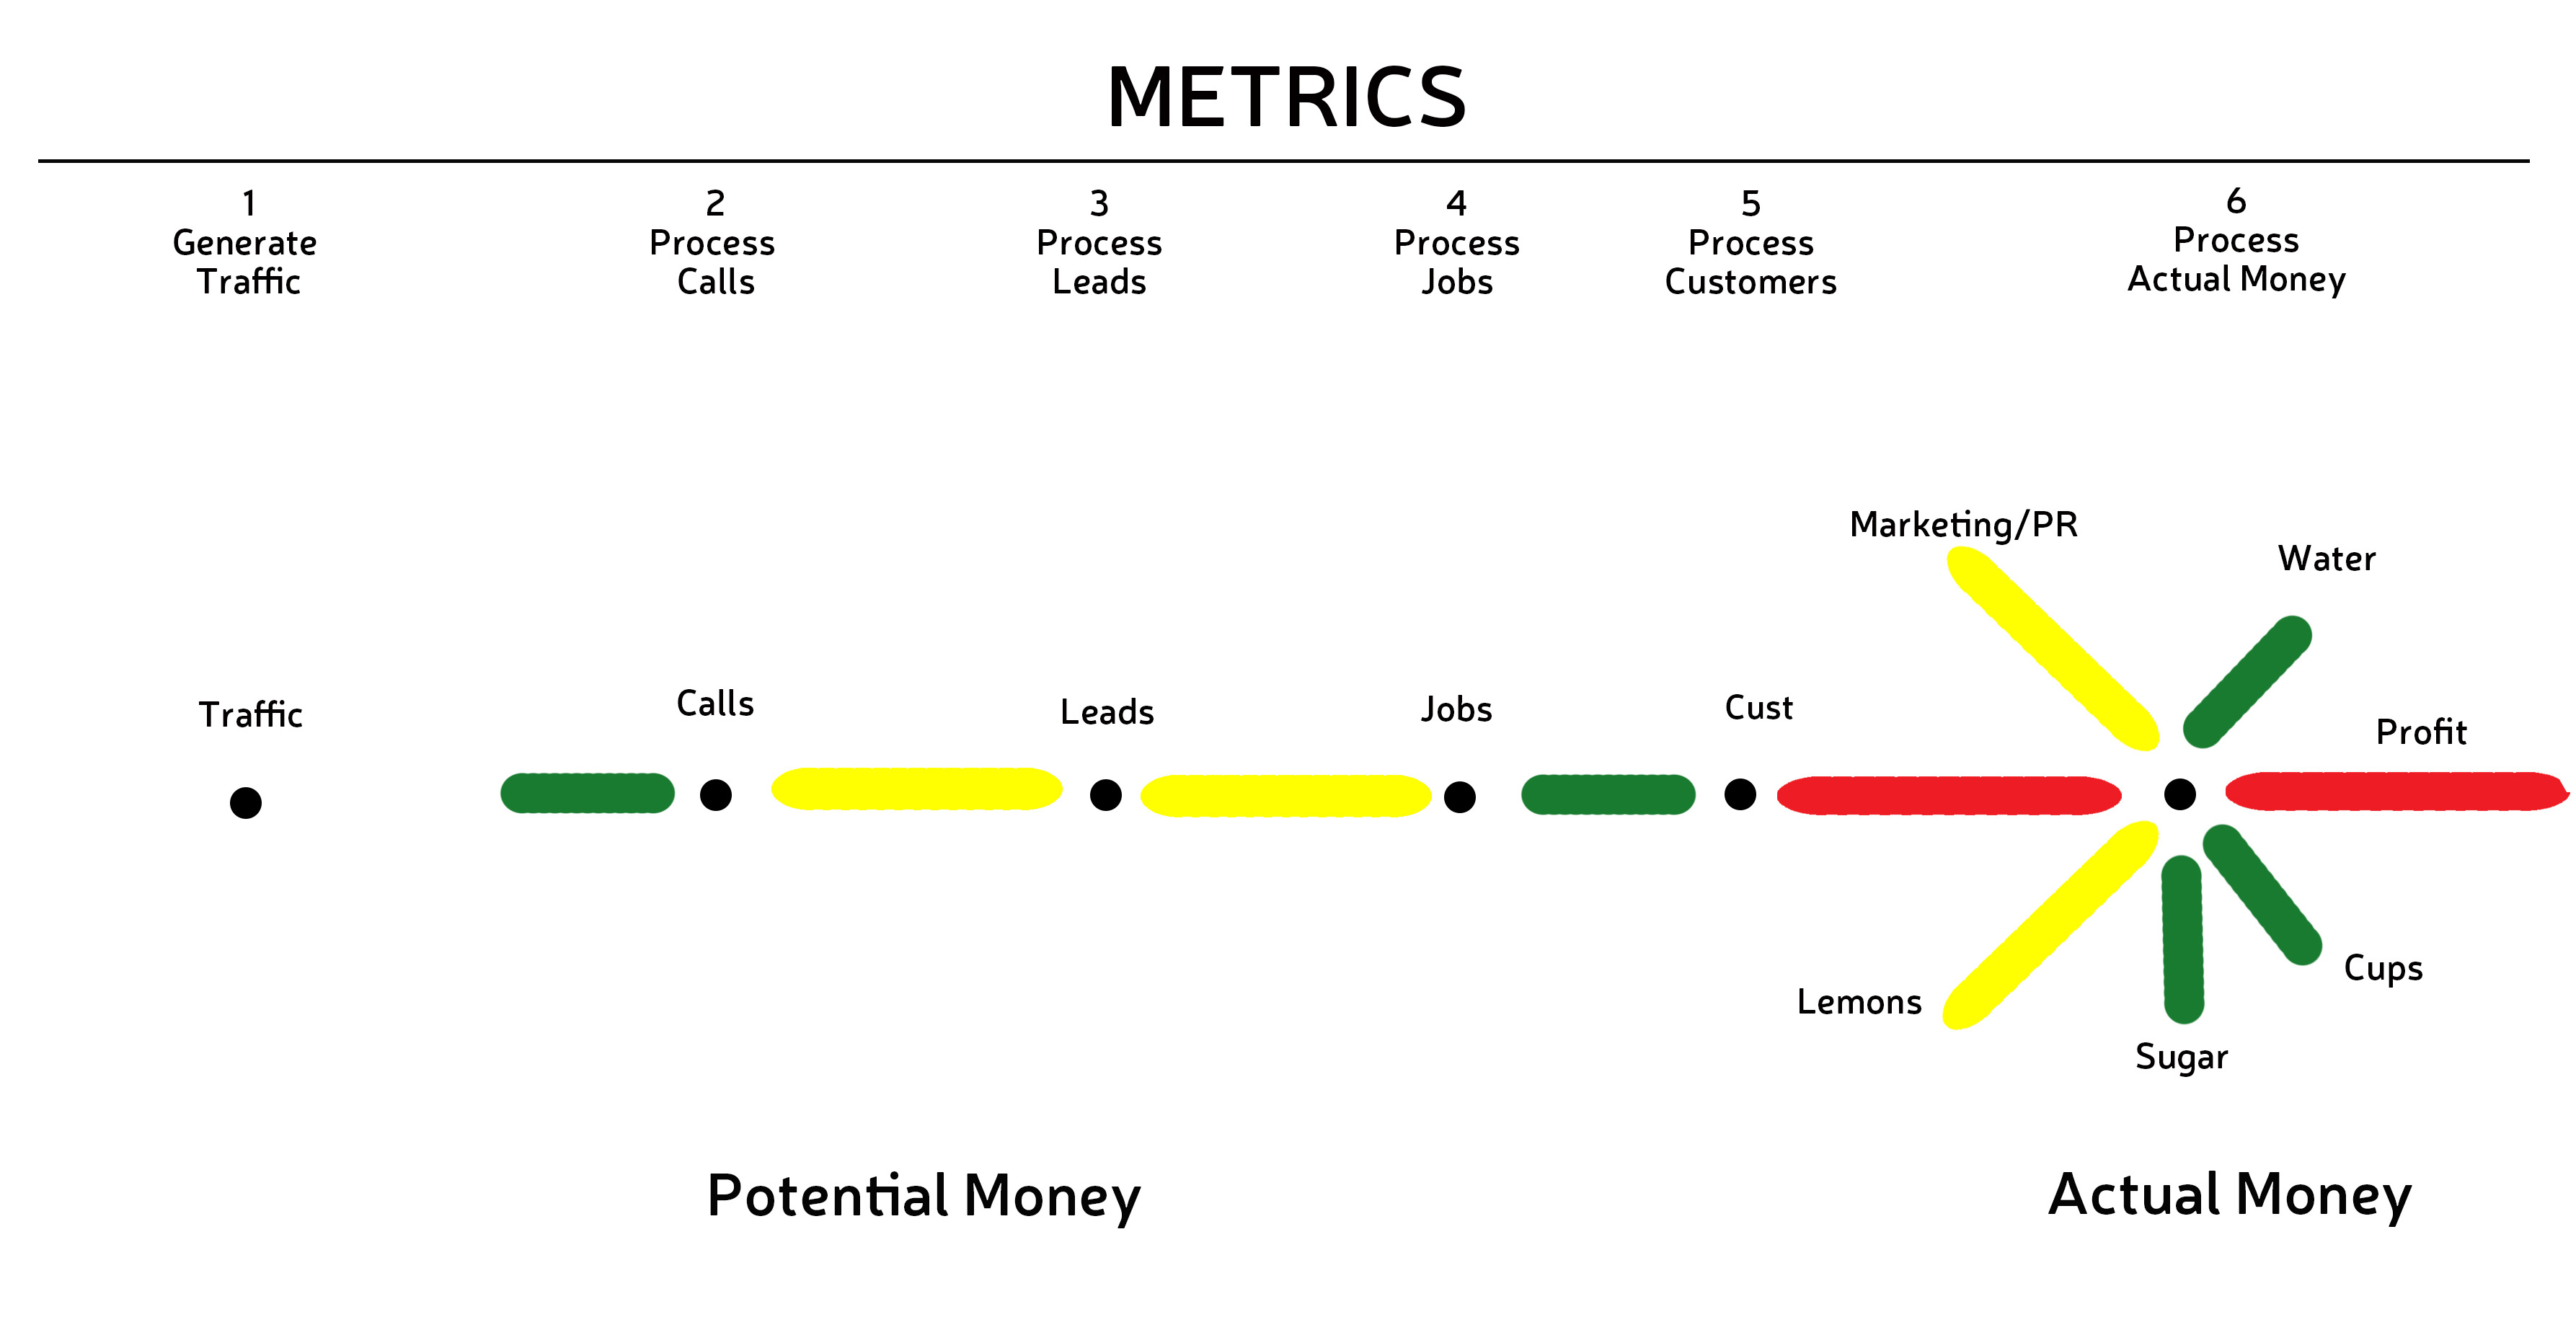 Overall, the engine seems to be performing well enough. But see those two red lines? That’s friction. If Lisa can improve performance in those places, her business will hum even smoother.
- In Business Visualization, modeling metrics starts with mapping out the places between gears in the money model and then determining what to measure at each of those places.
- The potential money side of the model is usually measured with objective metrics, based on actual numbers. The actual money side is usually measured with metrics based on more subjective assessments of quality.
- A medium length yellow line indicates when a process, department, or person meets a quality standard. A short green line means the standard has been surpassed. A long red line means the standard has not been met.
In the next section you will learn how to model the metrics in your own business.