SHOW ME THE MONEY: CREATING YOUR OWN SCALE MODEL
Now that you’ve seen how money works in Lisa’s Lemonade Stand, I’m going to walk you through creating a model of how money works in your own business.
The very first thing you’ll need to do is establish a timeframe for your model that is relevant to your business. There are natural time periods that people use (like quarterly reports) that might be a good starting point. Some businesses are cyclical over a multiple-year period, so you might want to use multiple years as the time scale. Still other businesses should be modeled on a monthly basis. It’s important to use operational data for a time period that matches the rhythm of your business.
The next step is gathering the relevant information—namely all of your business’s potential, actual, and theoretical numbers.
Finally, you’re going to need a way to render your visual model that’s not in your head. If you’re artistic, you can draw it out. If you’re crafty on a computer, use a program like Adobe Illustrator. Or, even better, get arts-and-crafty and print out the Money Model Kit from the Business Visualization Toolbox.
Ready? Great! Now that you’ve got your time period in mind, your numbers in hand, and a way to make a picture, we can get down to business.
STEP 1: ESTABLISH ORDER
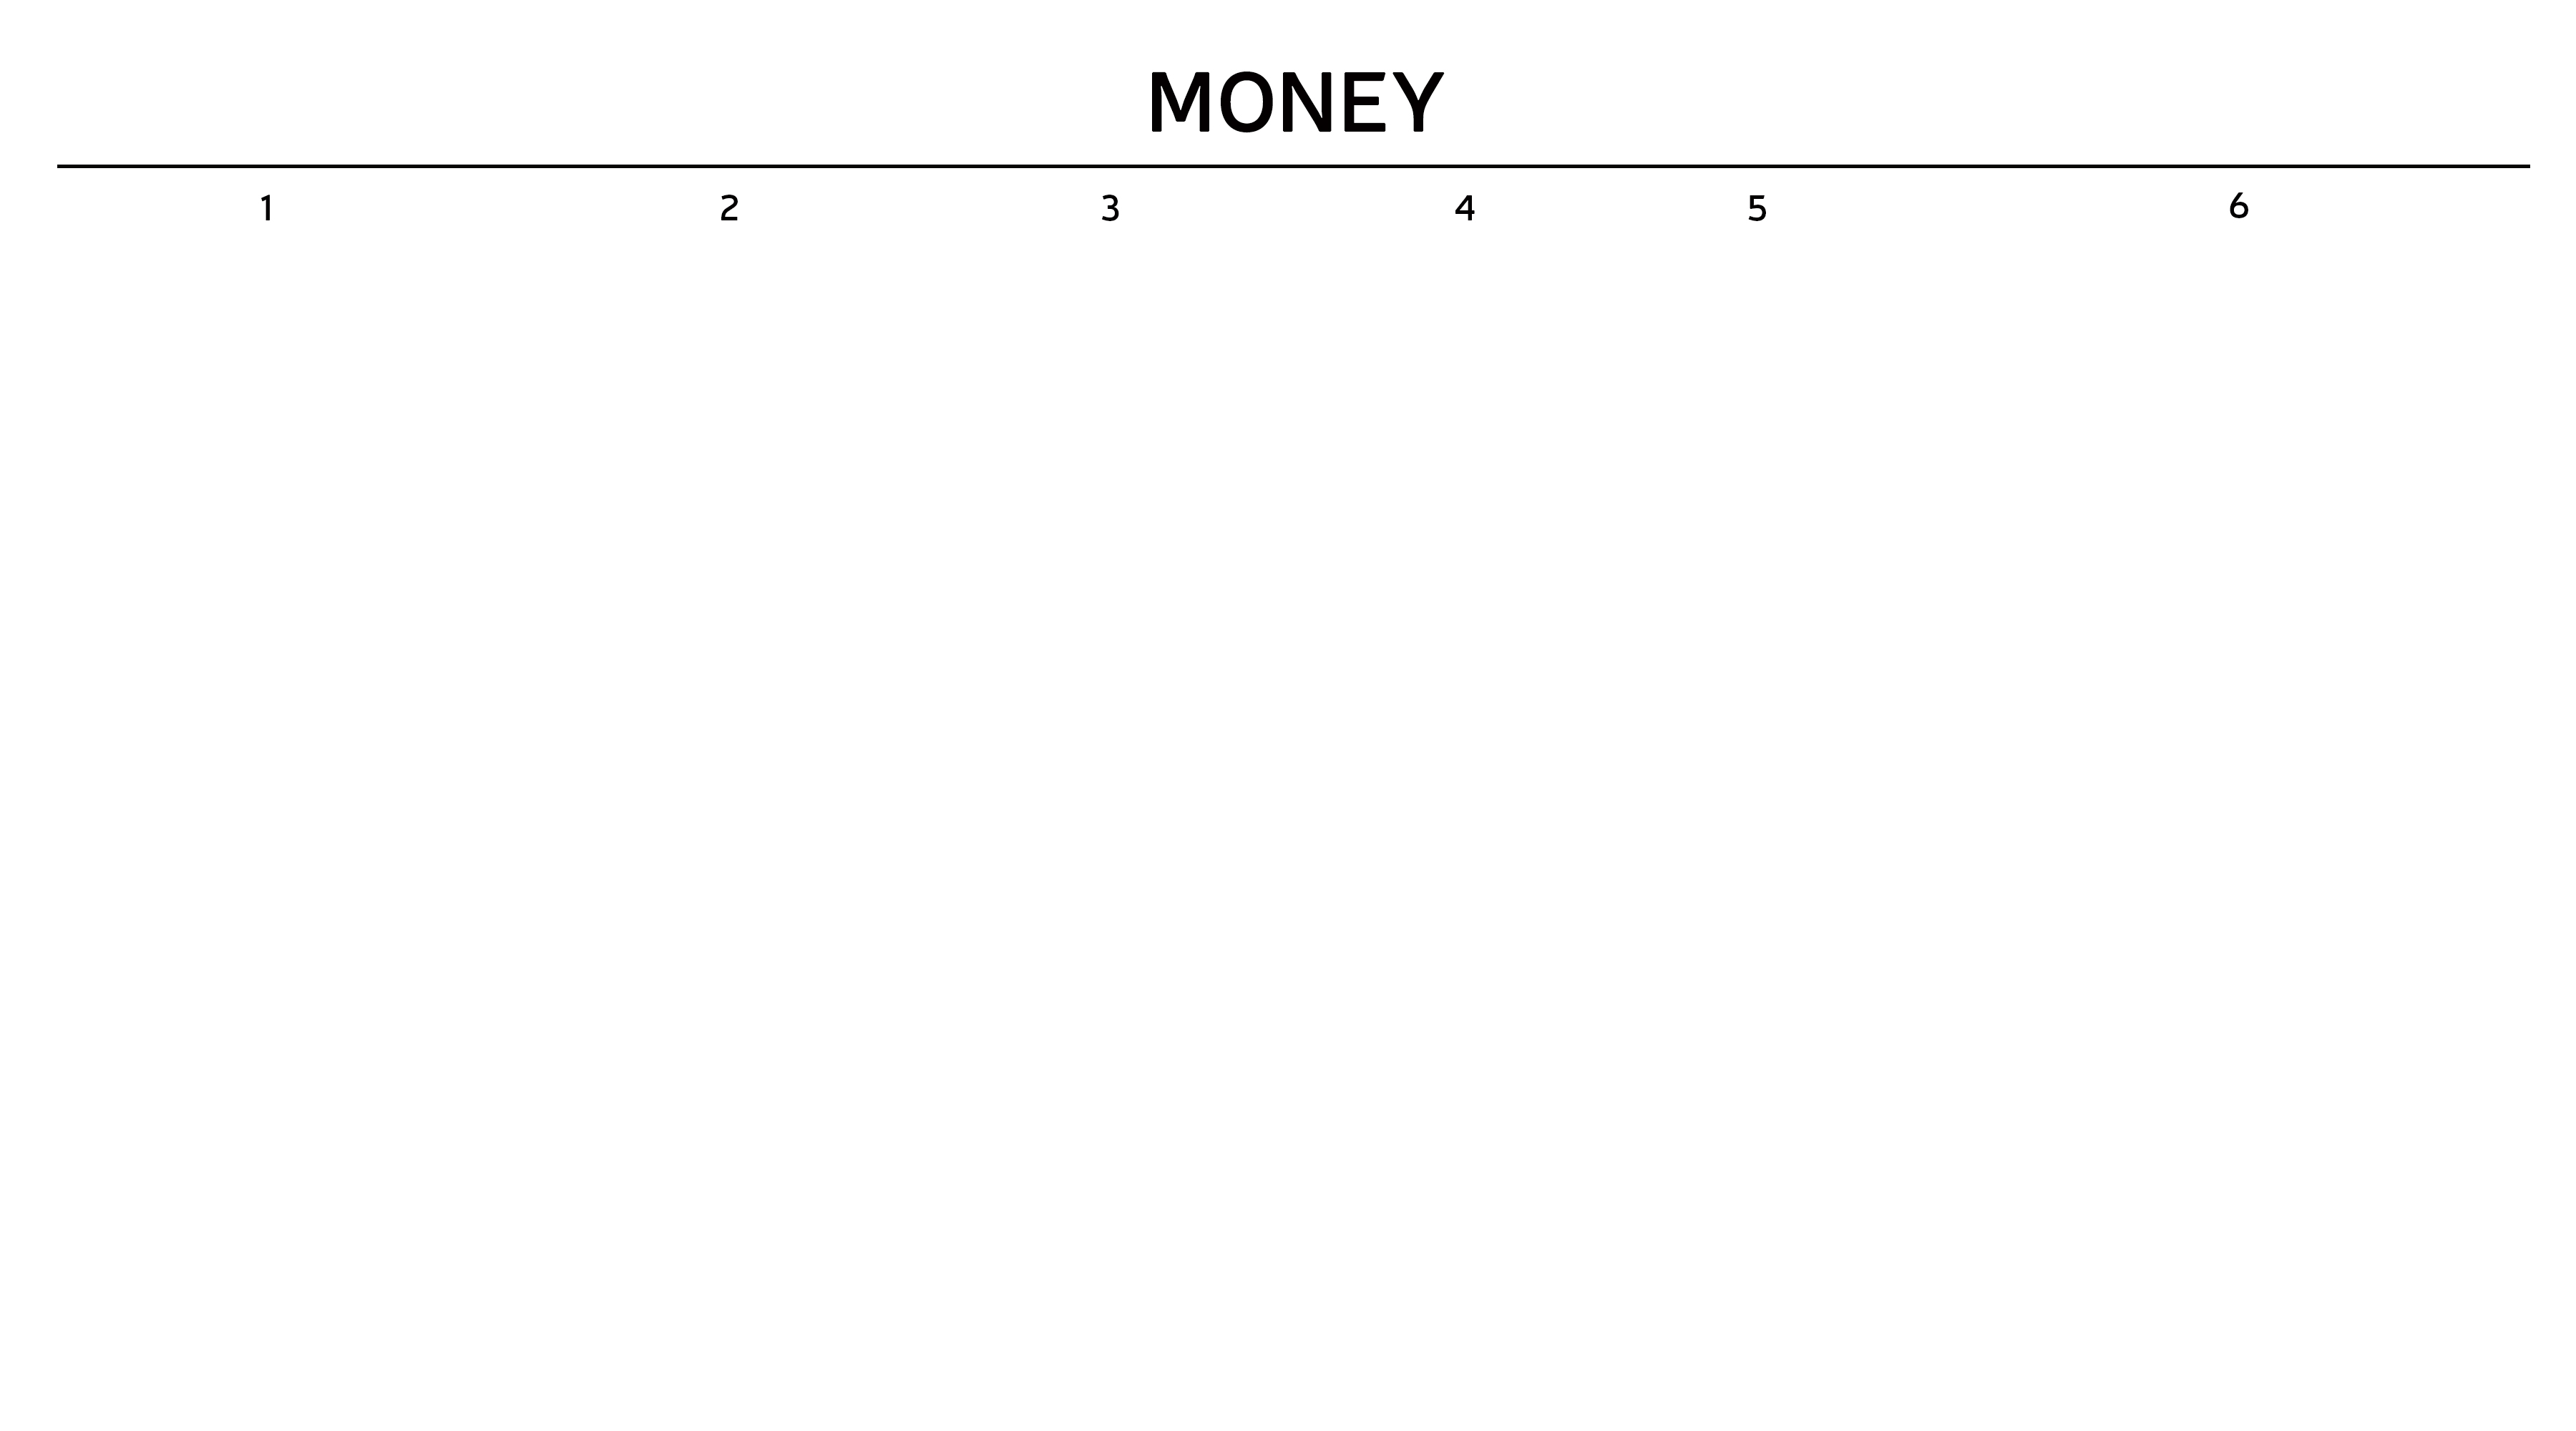
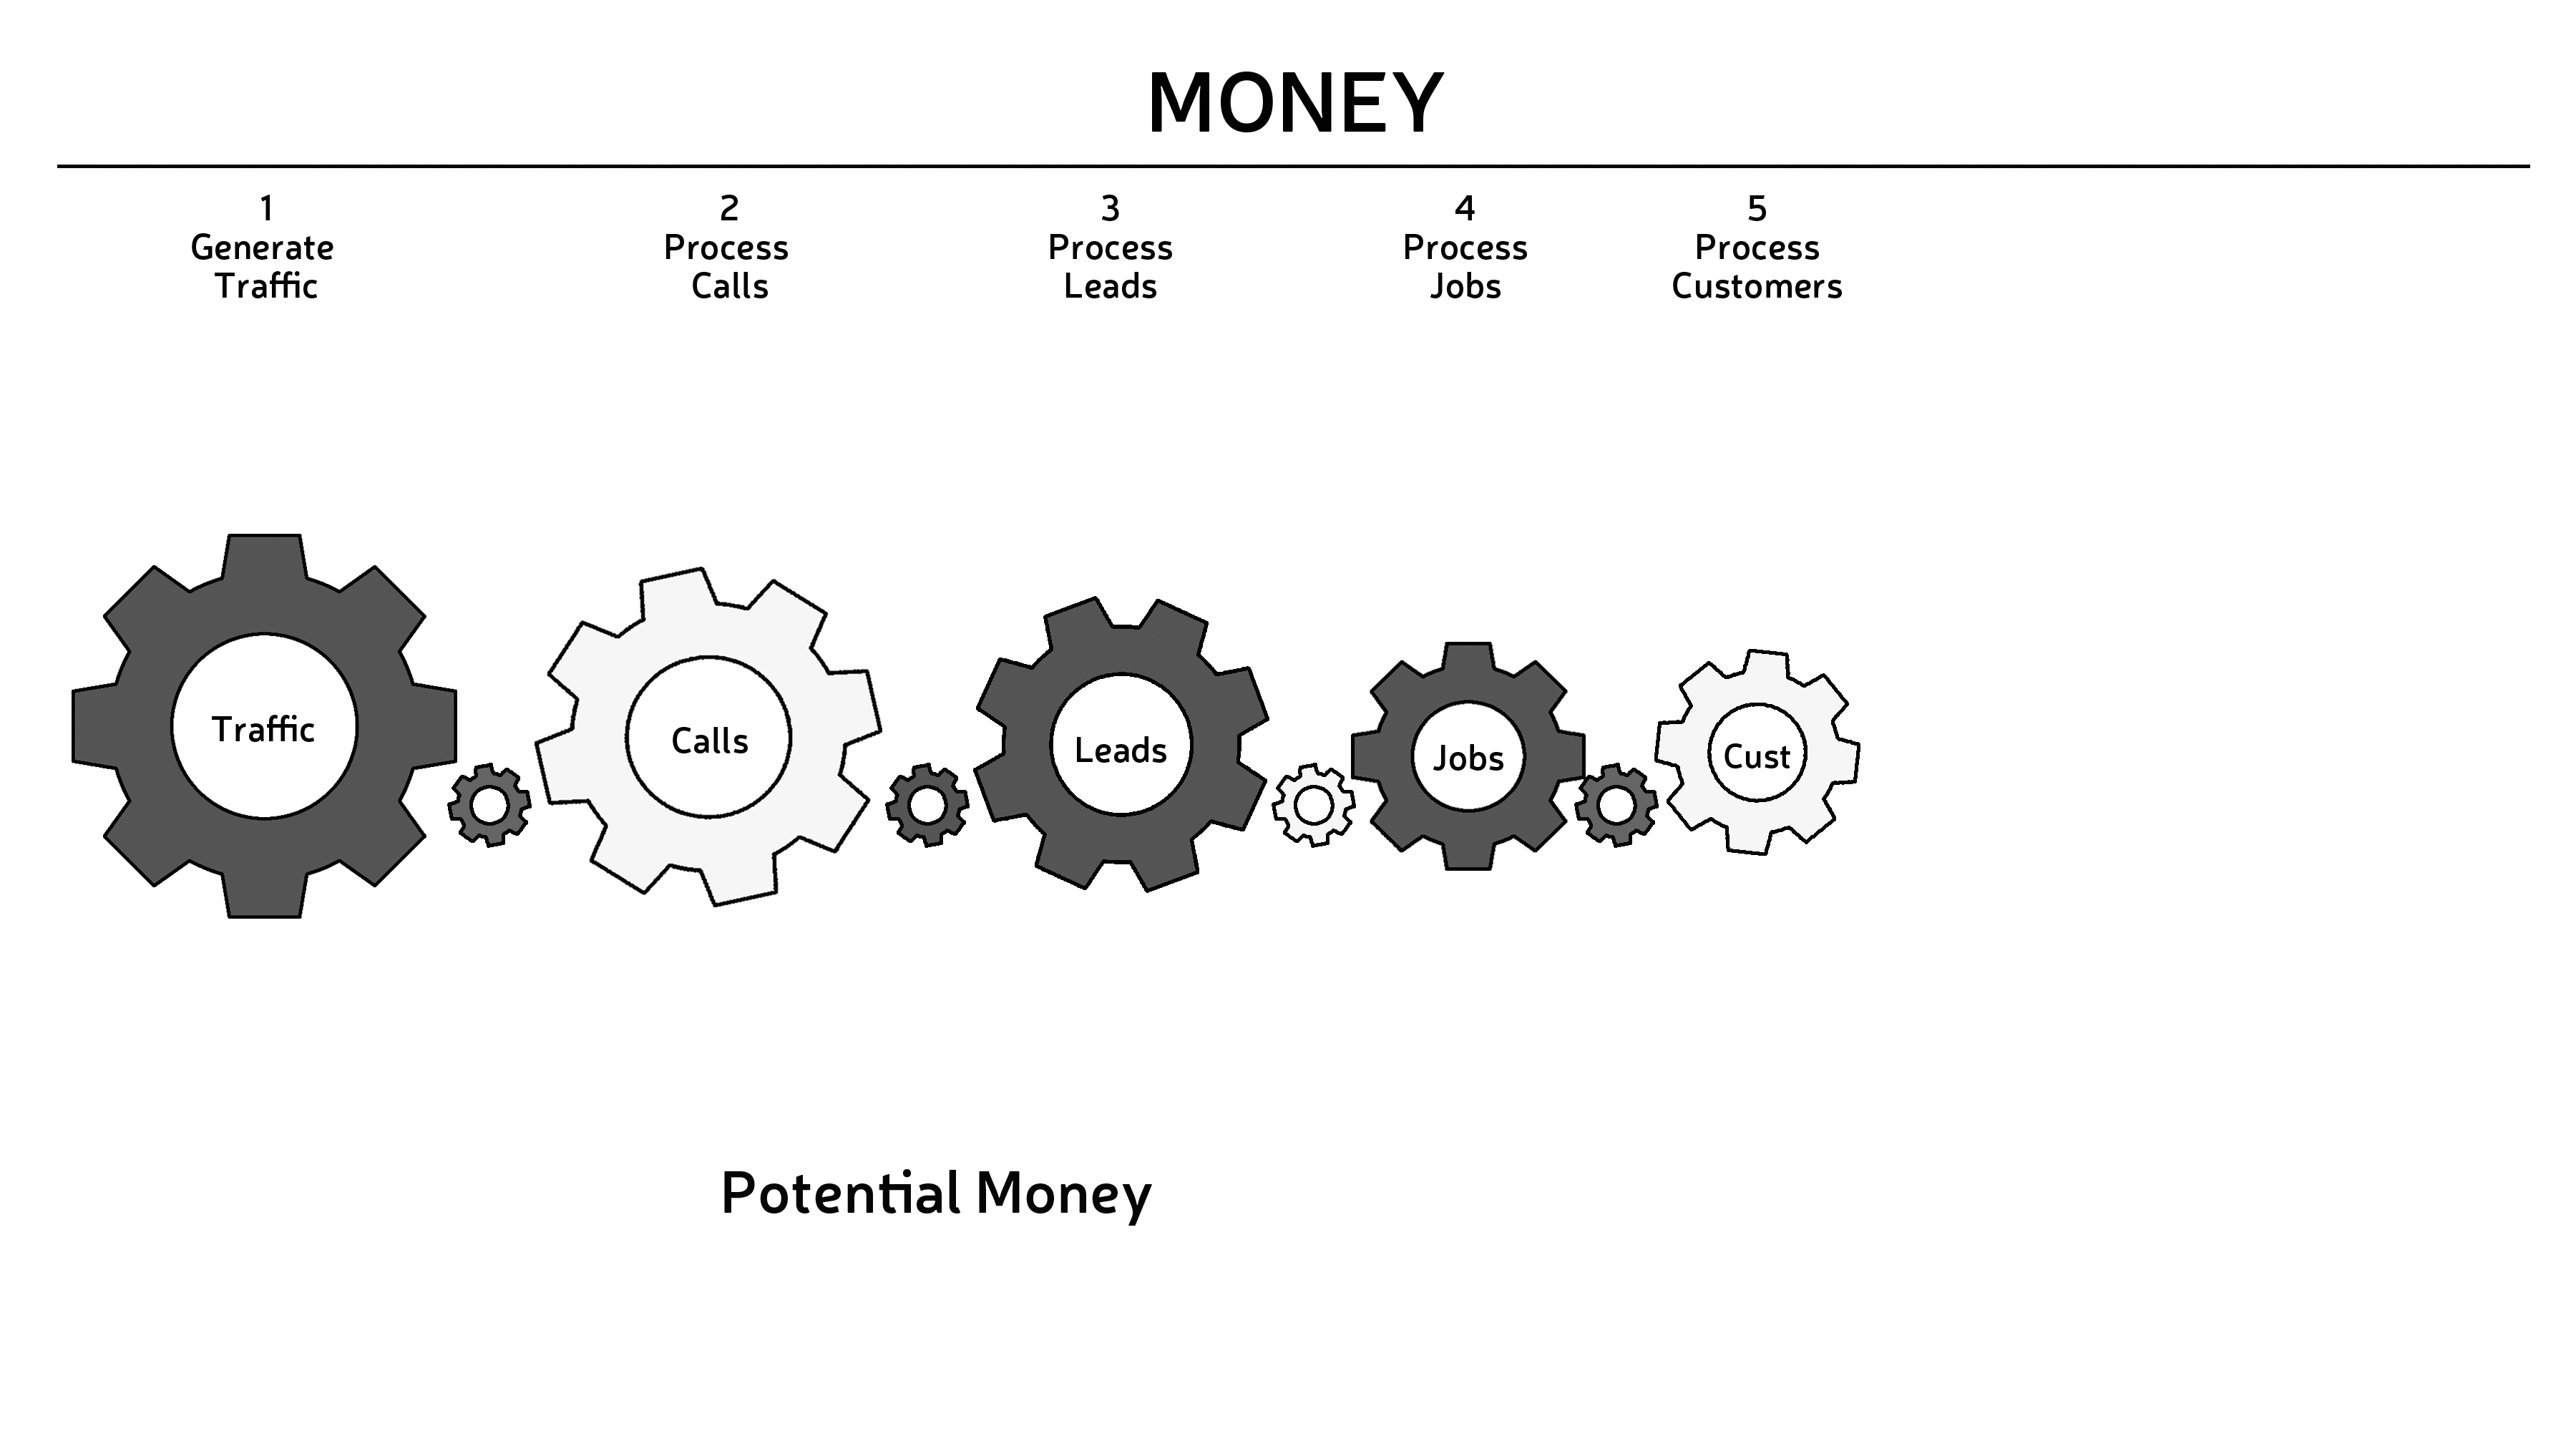
The first thing you’ll want to do to visualize the flow of money through your business engine is to create a kind of timeline. Draw a line and divide it into six sections. Number each section, 1-6.
 The first five sections represent your potential money. Starting at the far left, label these as follows:
- Generate Traffic
- Process Calls
- Process Leads
- Process Jobs
- Process Customers
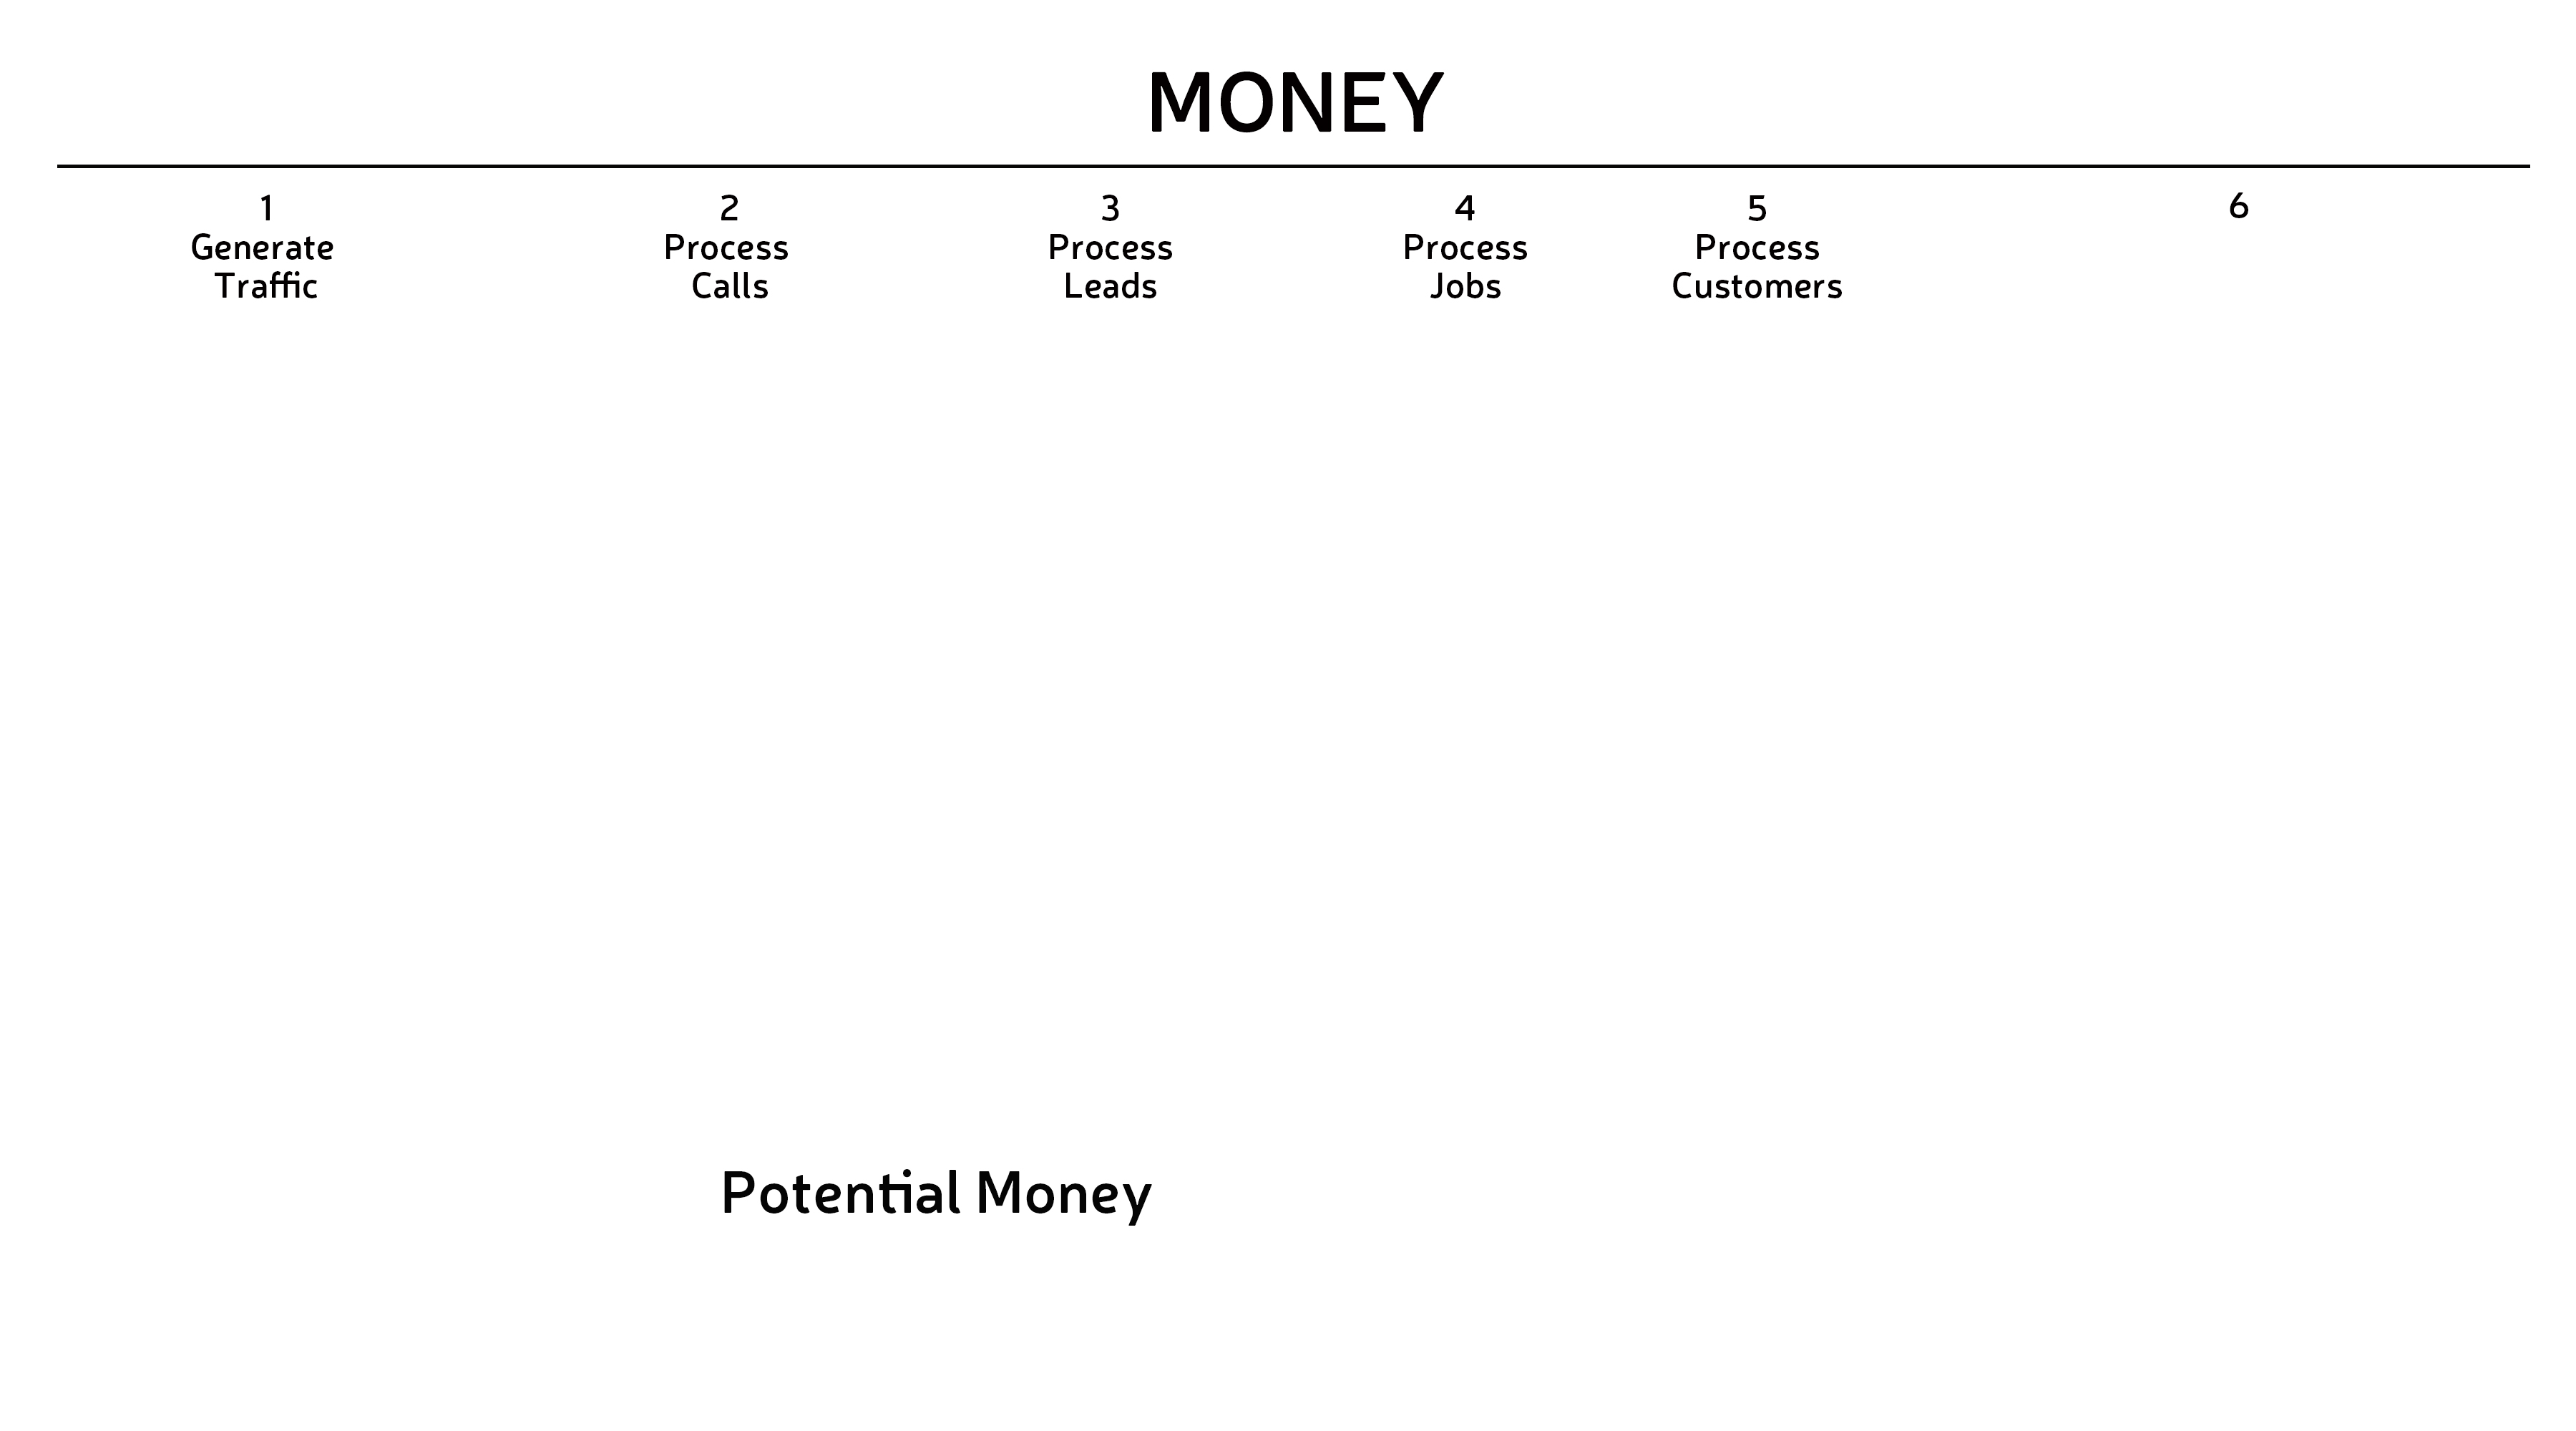 Moving from left to right, this line represents the chronological order of processes in your business engine. First, someone hears about your business—that’s Traffic (1). Next, someone calls or e-mails your business to see if they want to buy your product or service—that’s a Call (2). If the call is qualified to make the purchase, they become a Lead (3). Once they are a lead, you send a crew to their location or ship a product to them and they become a Job (4). Finally, when they pay you, they become a customer (5).
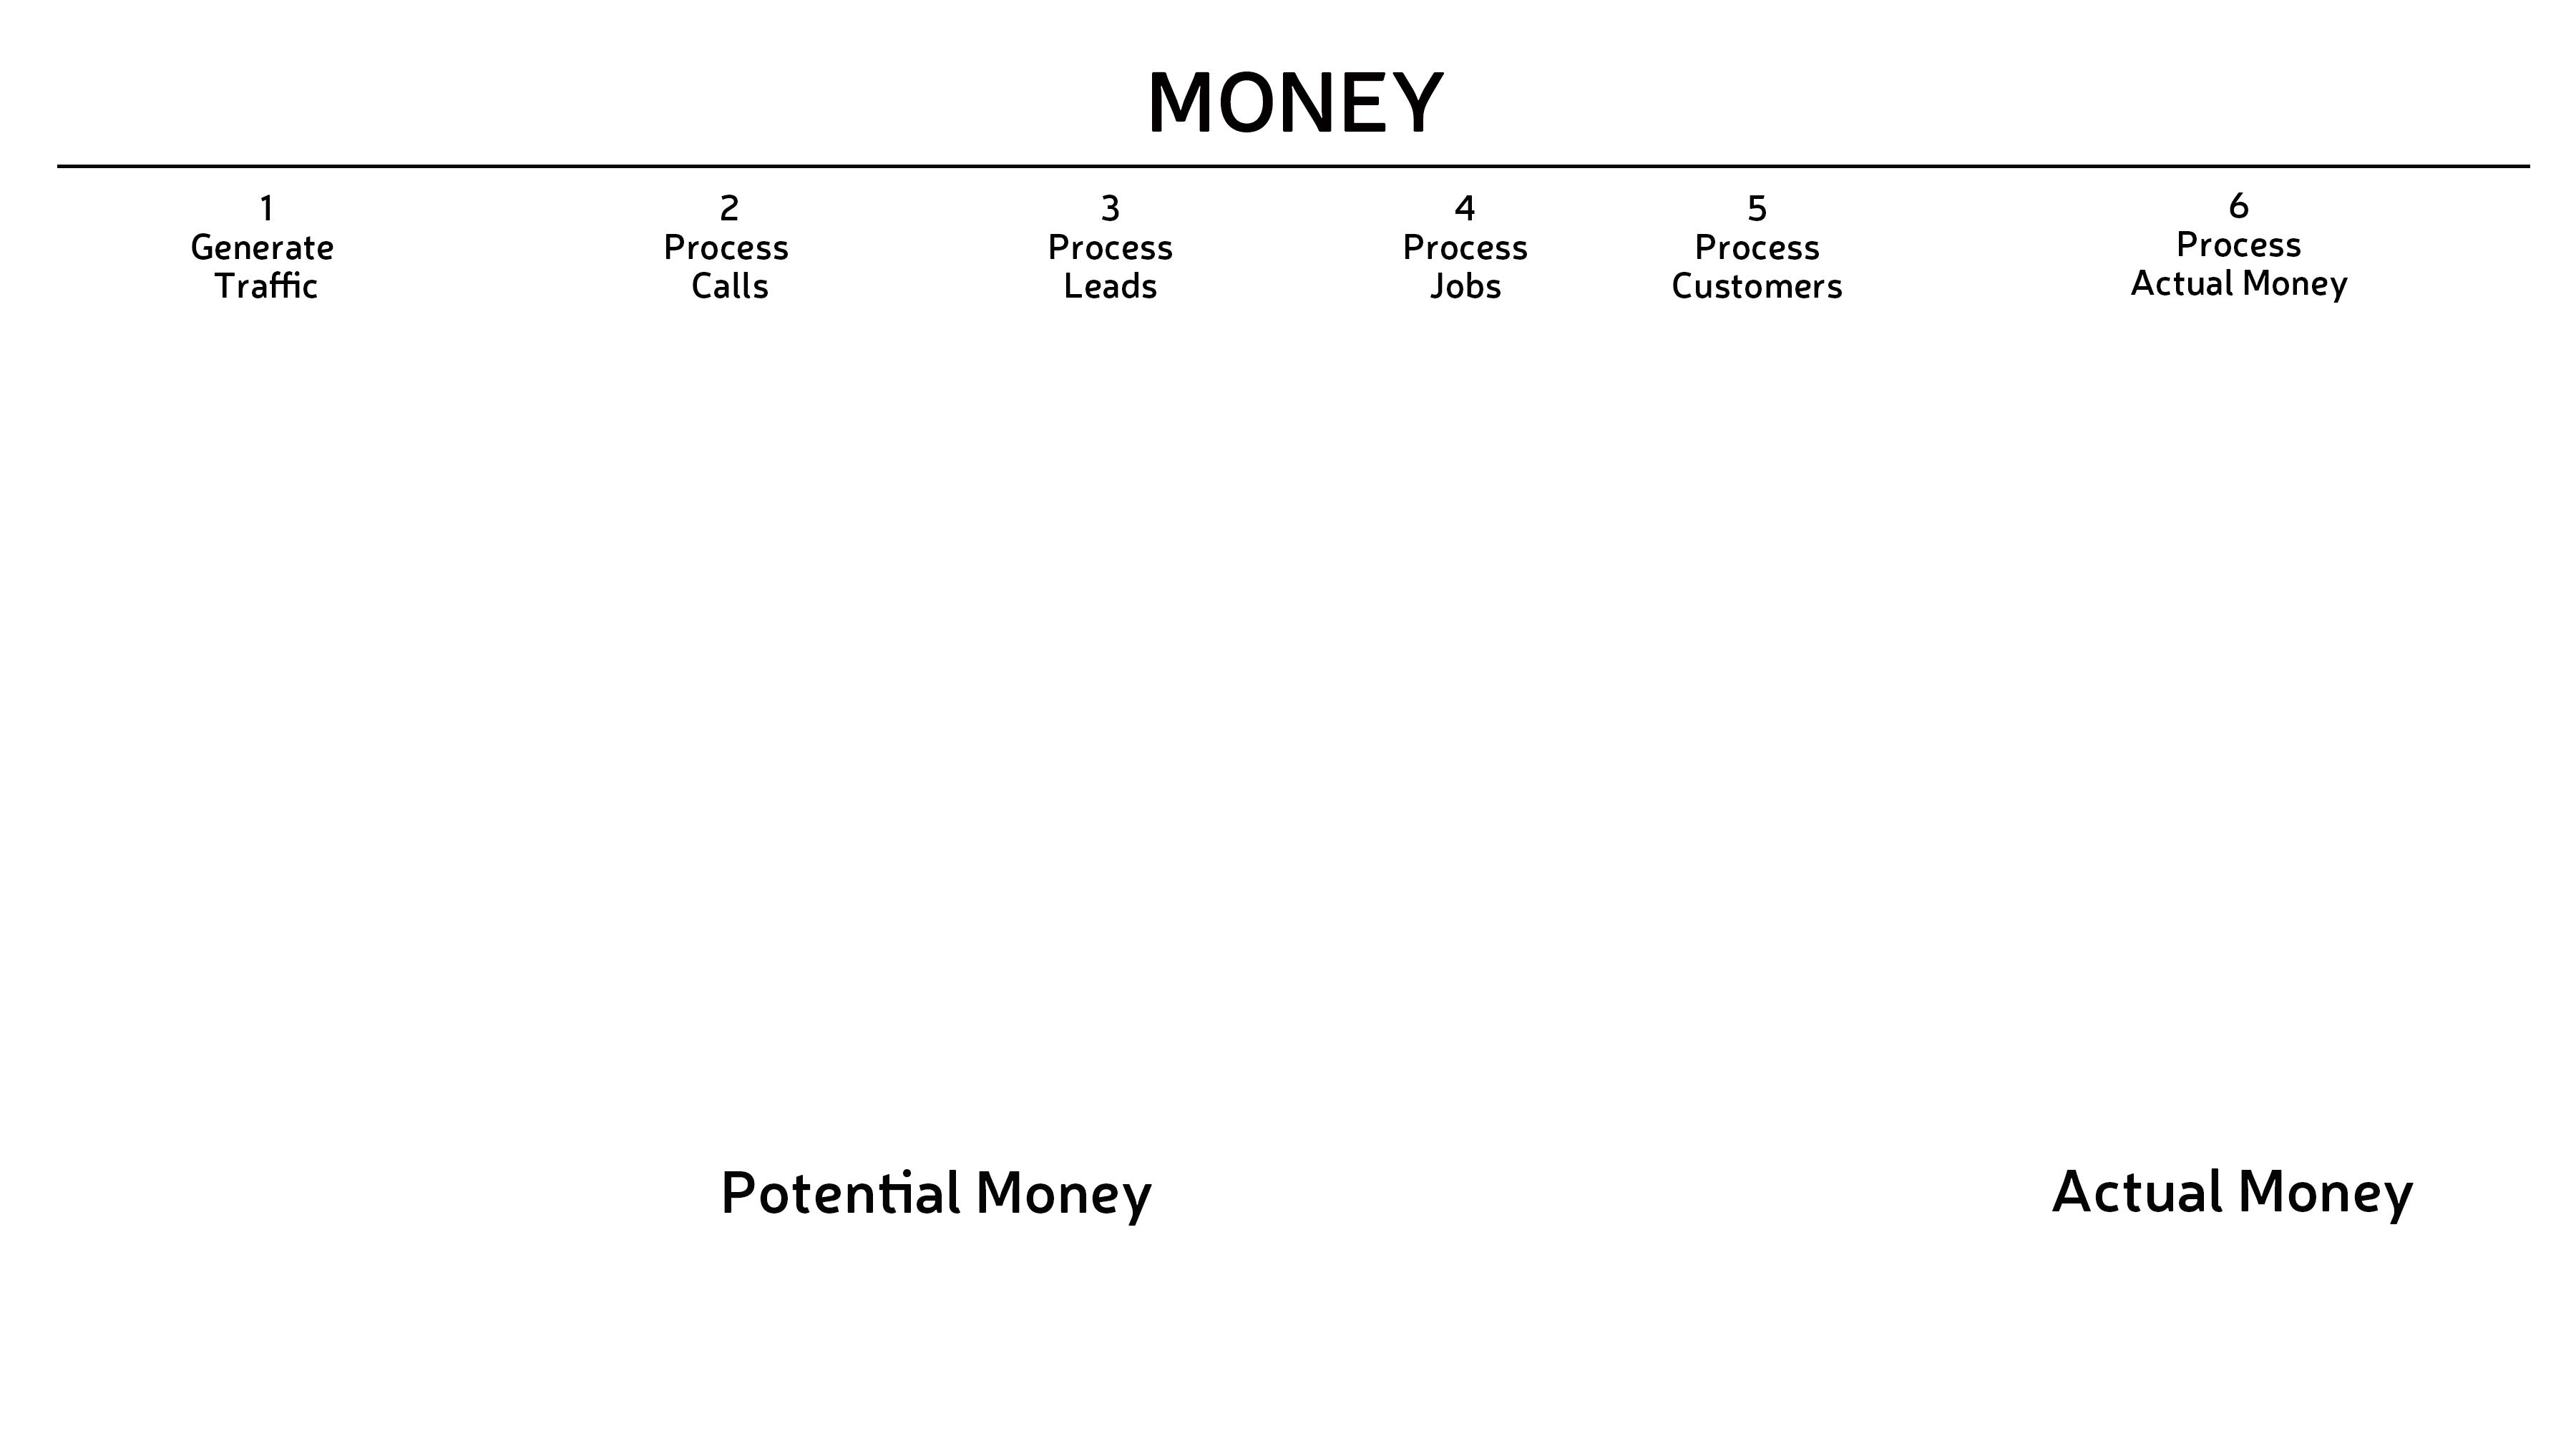
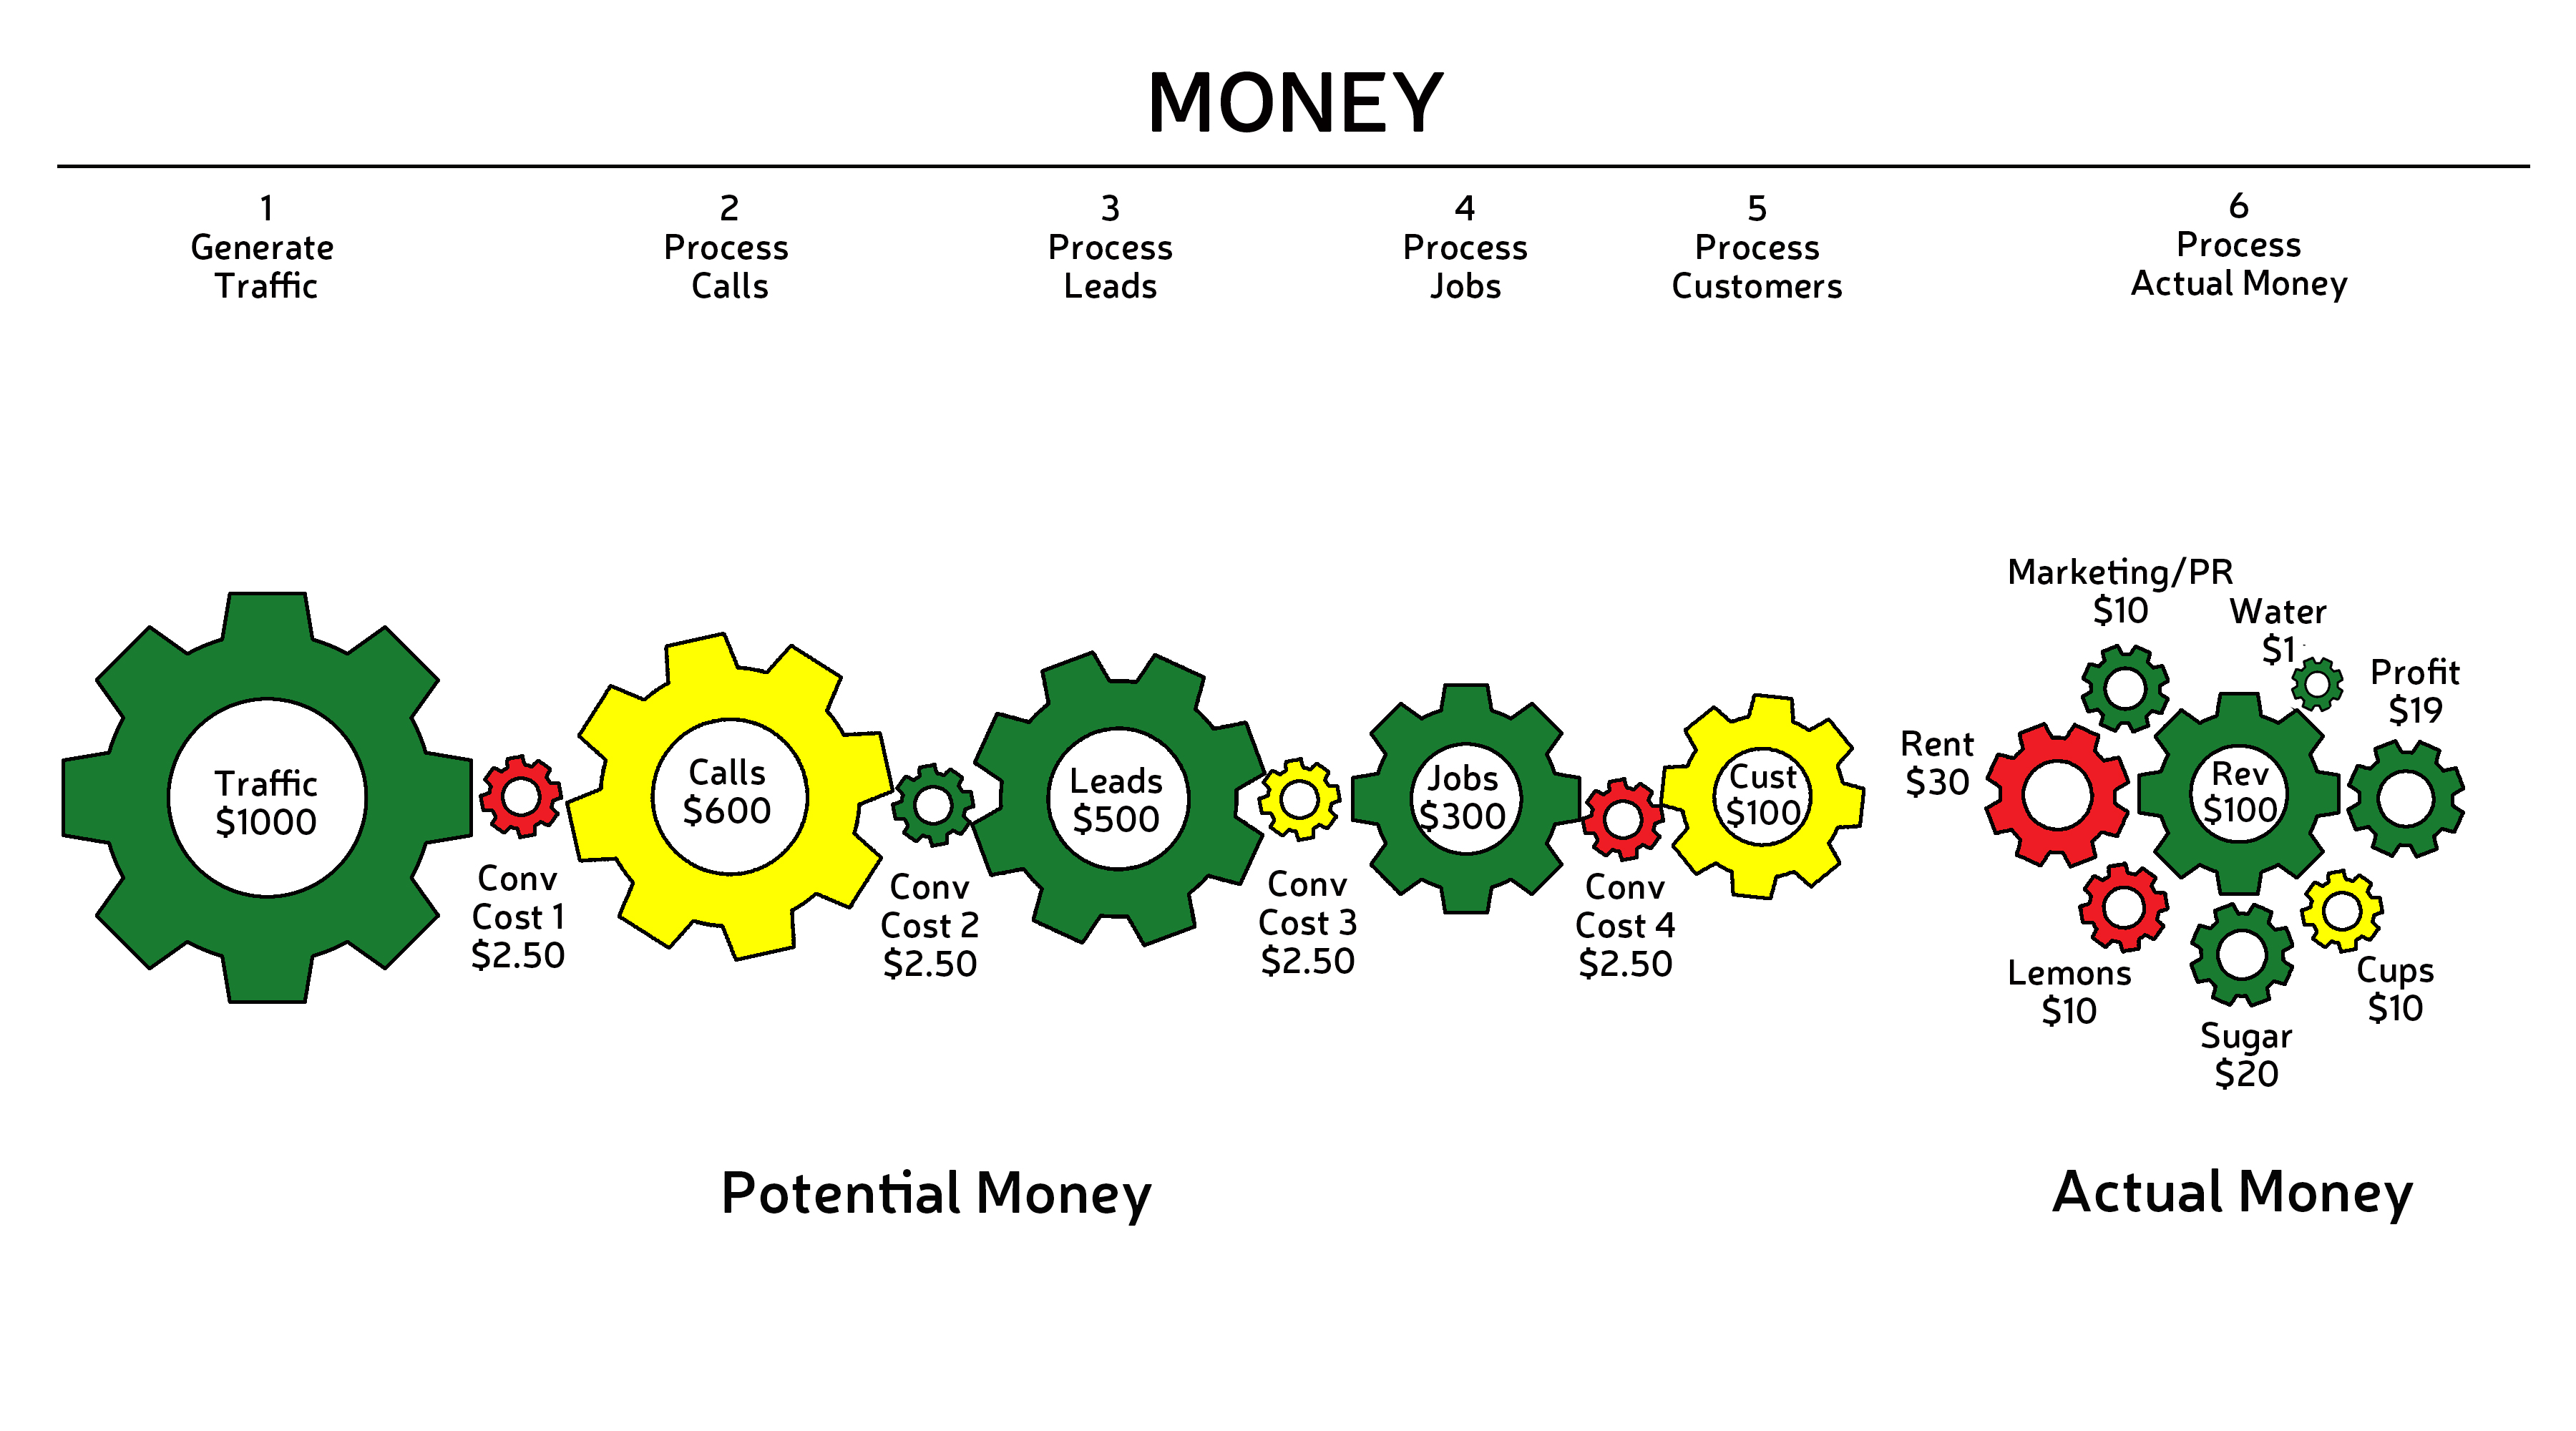
Now, you might be wondering about the sixth, rightmost section. Label this section “Actual Money.” It’s where your revenue, costs, and profit come into the picture.
 STEP 2: DETERMINE SCALE OF ACTUAL MONEY
In a business, all of the money is connected by dynamic ratios, which, as you can probably guess by now, we will represent as gears (remember: Energy=Money=Gears). If you know the size of one gear and you know the ratios between it and other gears, you can build a scale model of them all.
For our purposes, the key gear is REVENUE. The revenue gear is always scaled to 100%. It represents 100% of the money you actually have. For example, if your business does $1M a year in sales, the size of the revenue gear represents $1M worth of money.

So, first things first: Consult your income statement. Find your revenue for the time period you’ve chosen. Represent it with a gear. Place this gear under the section of your timeline labeled “Actual Money.”
Easy, right?
Now look at your income statement again. Each line item on it is a percentage of your revenue. Therefore, your revenue gear will establish the scale for every other gear. For example, if your profit is 20% of the revenue, then the profit gear will be 20% of the size of the revenue gear.
 Next, calculate what percentage of revenue each item on your income statement represents. Still working under the section of your timeline labeled “Actual Money,” place your expense gears around your revenue gear. Place your profit gear all the way to the right, as shown in the picture above.
STEP 3: DETERMINE SCALE OF POTENTIAL MONEY
Now we’re ready to visualize the Sales Funnel.
Again, the revenue gear will be key. Just like with the income statement items, each component of the sales funnel is a ratio of the revenue gear. We’ll calculate the scale of each sales funnel gear by multiplying the number of people by the average ticket size. So for this step in the modeling process, you’re going to need to know your average ticket size, as well as how many customers, jobs, leads, and calls you have, and the size of your traffic.
When determining the scale of each sales funnel gear, work from right to left, starting with customers.
CUSTOMERS
The rightmost gear in the sales funnel represents your customers. These are the people that actually pay for your product or service. The customer gear is always scaled to 100% of the revenue gear because the number of customers times the average ticket size equals the actual revenue. 10,000 customers times an average ticket size of $100 equals your revenue, in this case, $1M. So $1M in customers is equal to $1M in revenue, which means that the size of the customer gear is always the same as the size of the revenue gear.
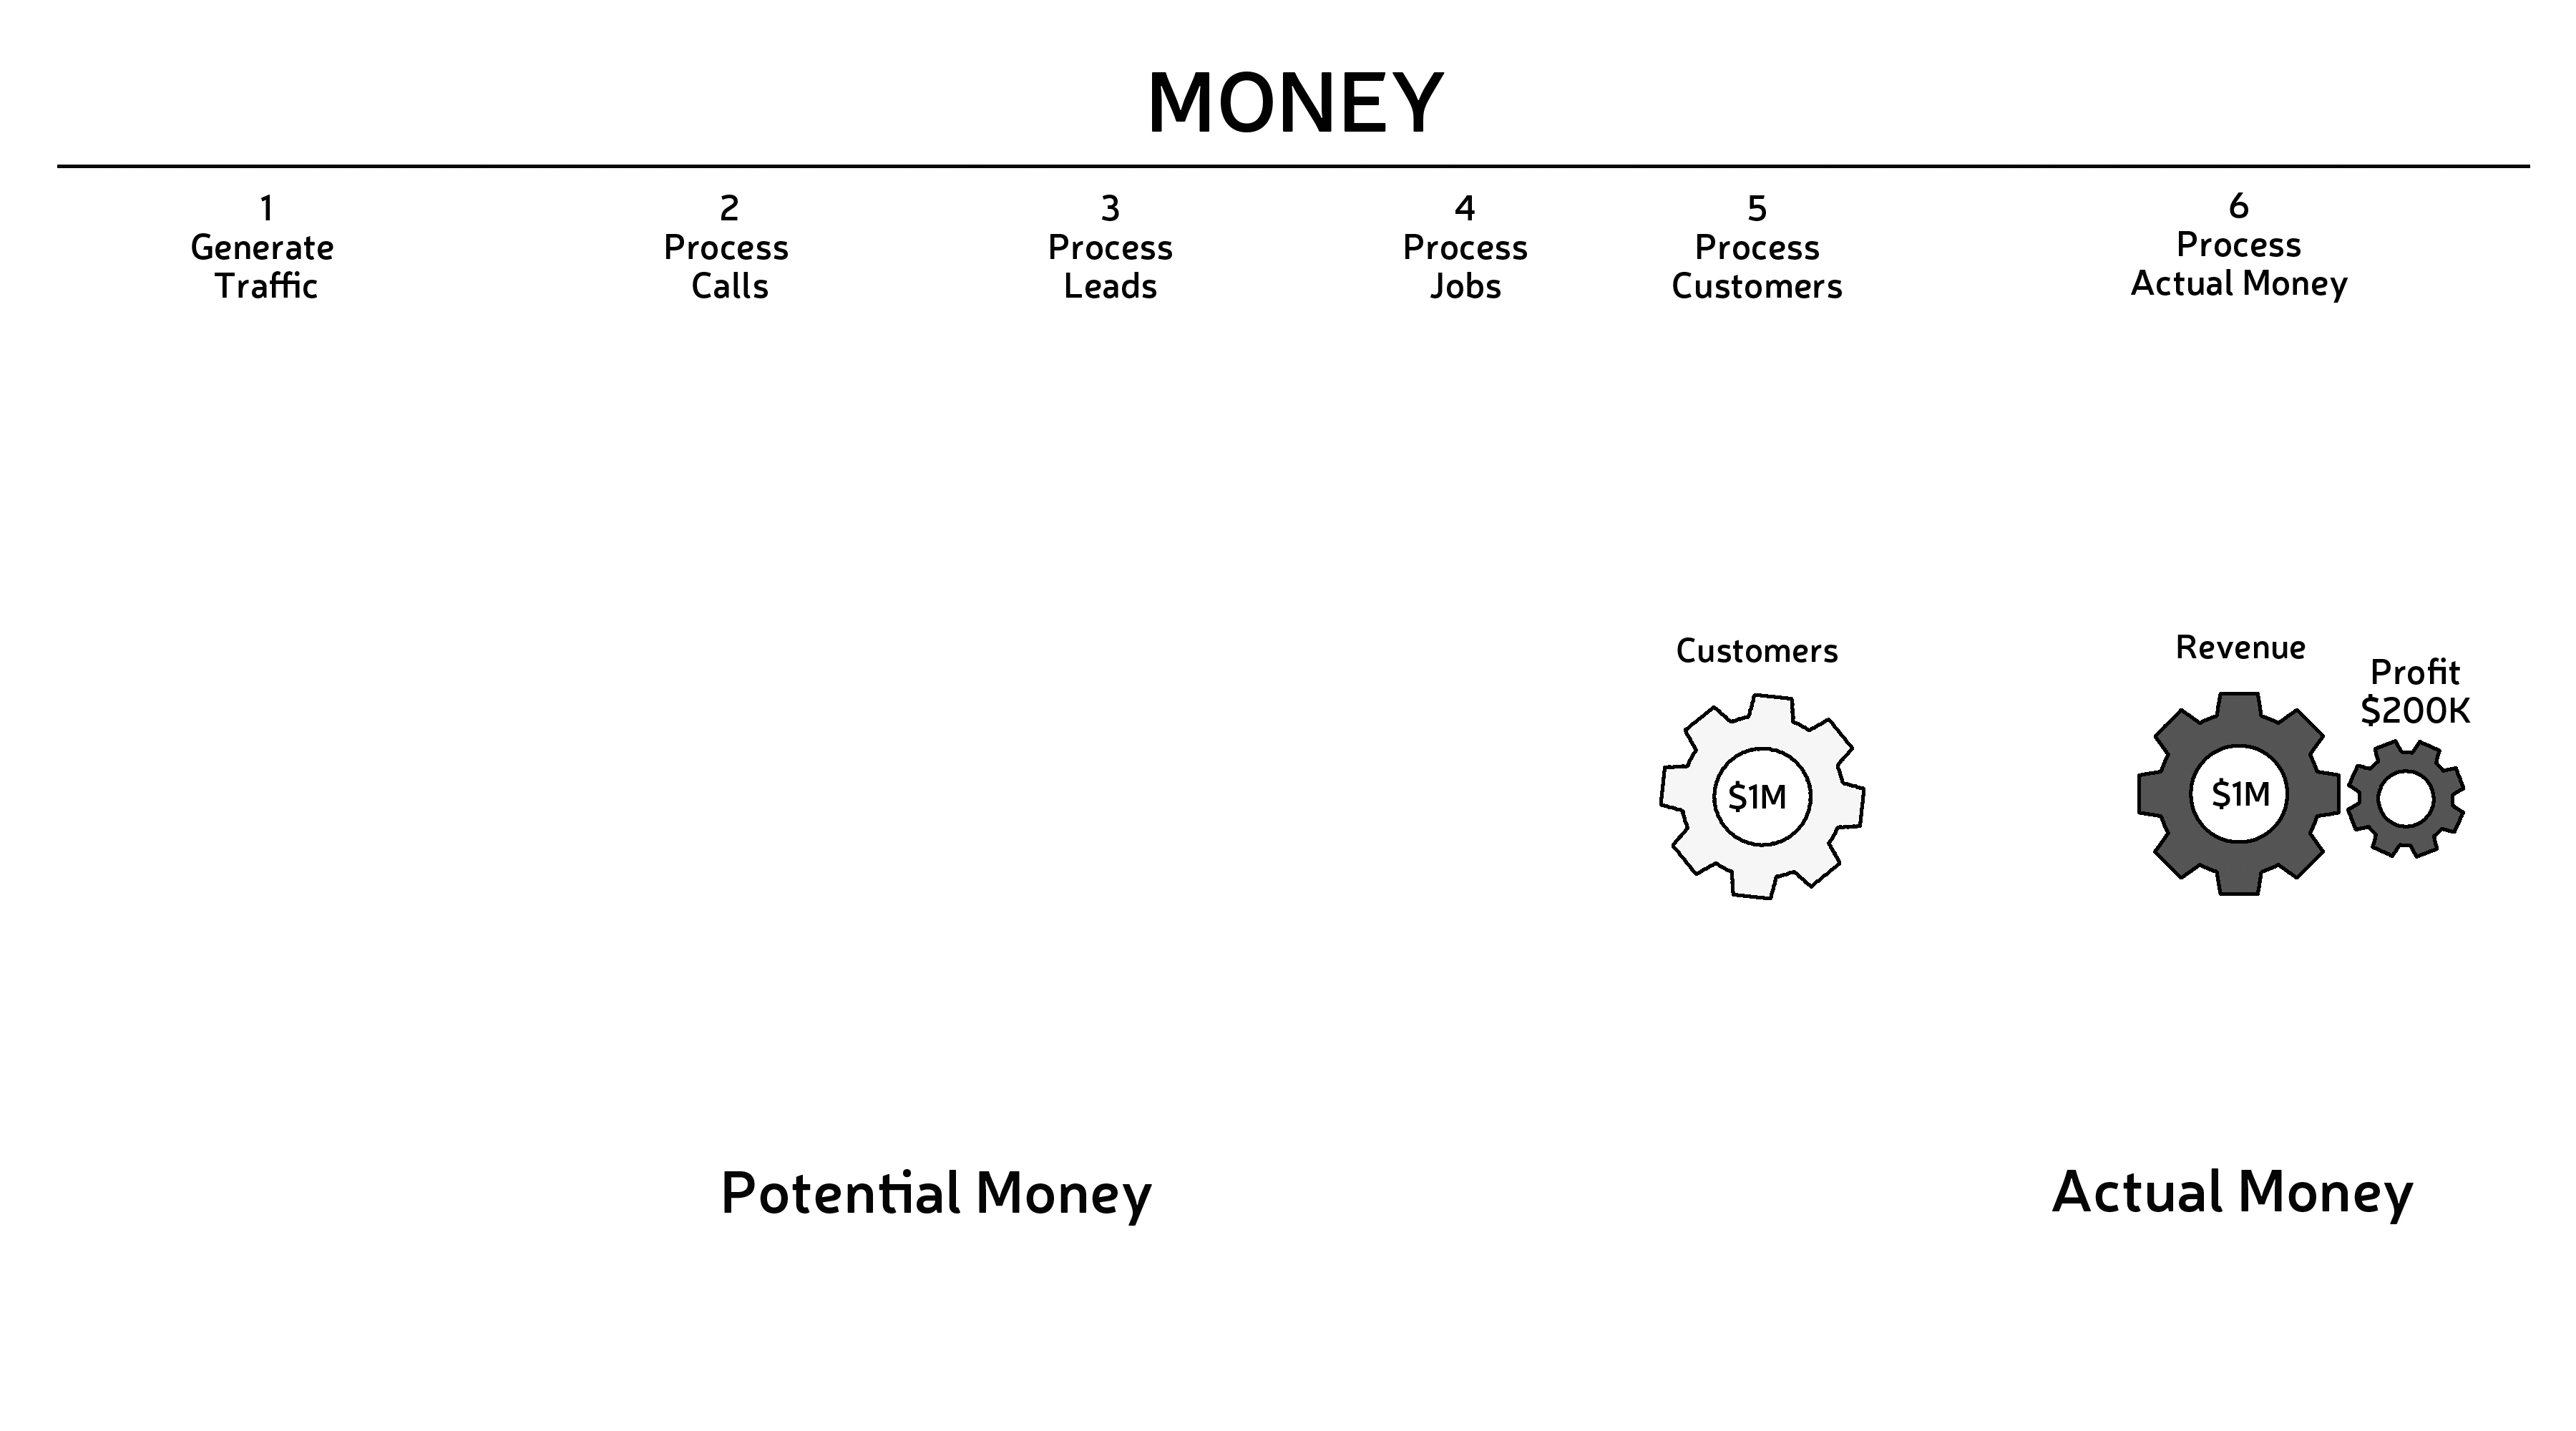 Go ahead and insert your customer gear into your model under section 5 of your time line, labeled “Customers”.
JOBS
Moving to the left, the next gear in the sales funnel is Jobs. Jobs are the people who schedule or order your product or service. To determine the size of your job gear, multiply the number of jobs by the average ticket size. The job gear will always be larger than the customer gear because the number of jobs will always be larger than customers. Unfortunately, no matter how great your product is, there will always be a few people who fail to follow through on an order or with a payment. If your revenue is $1M, you must have done more than $1M in jobs. In my 1-800-GOT-JUNK? business, we have .5% bad debt, so the size of the jobs gear is 1.005 the size of the customers gear.
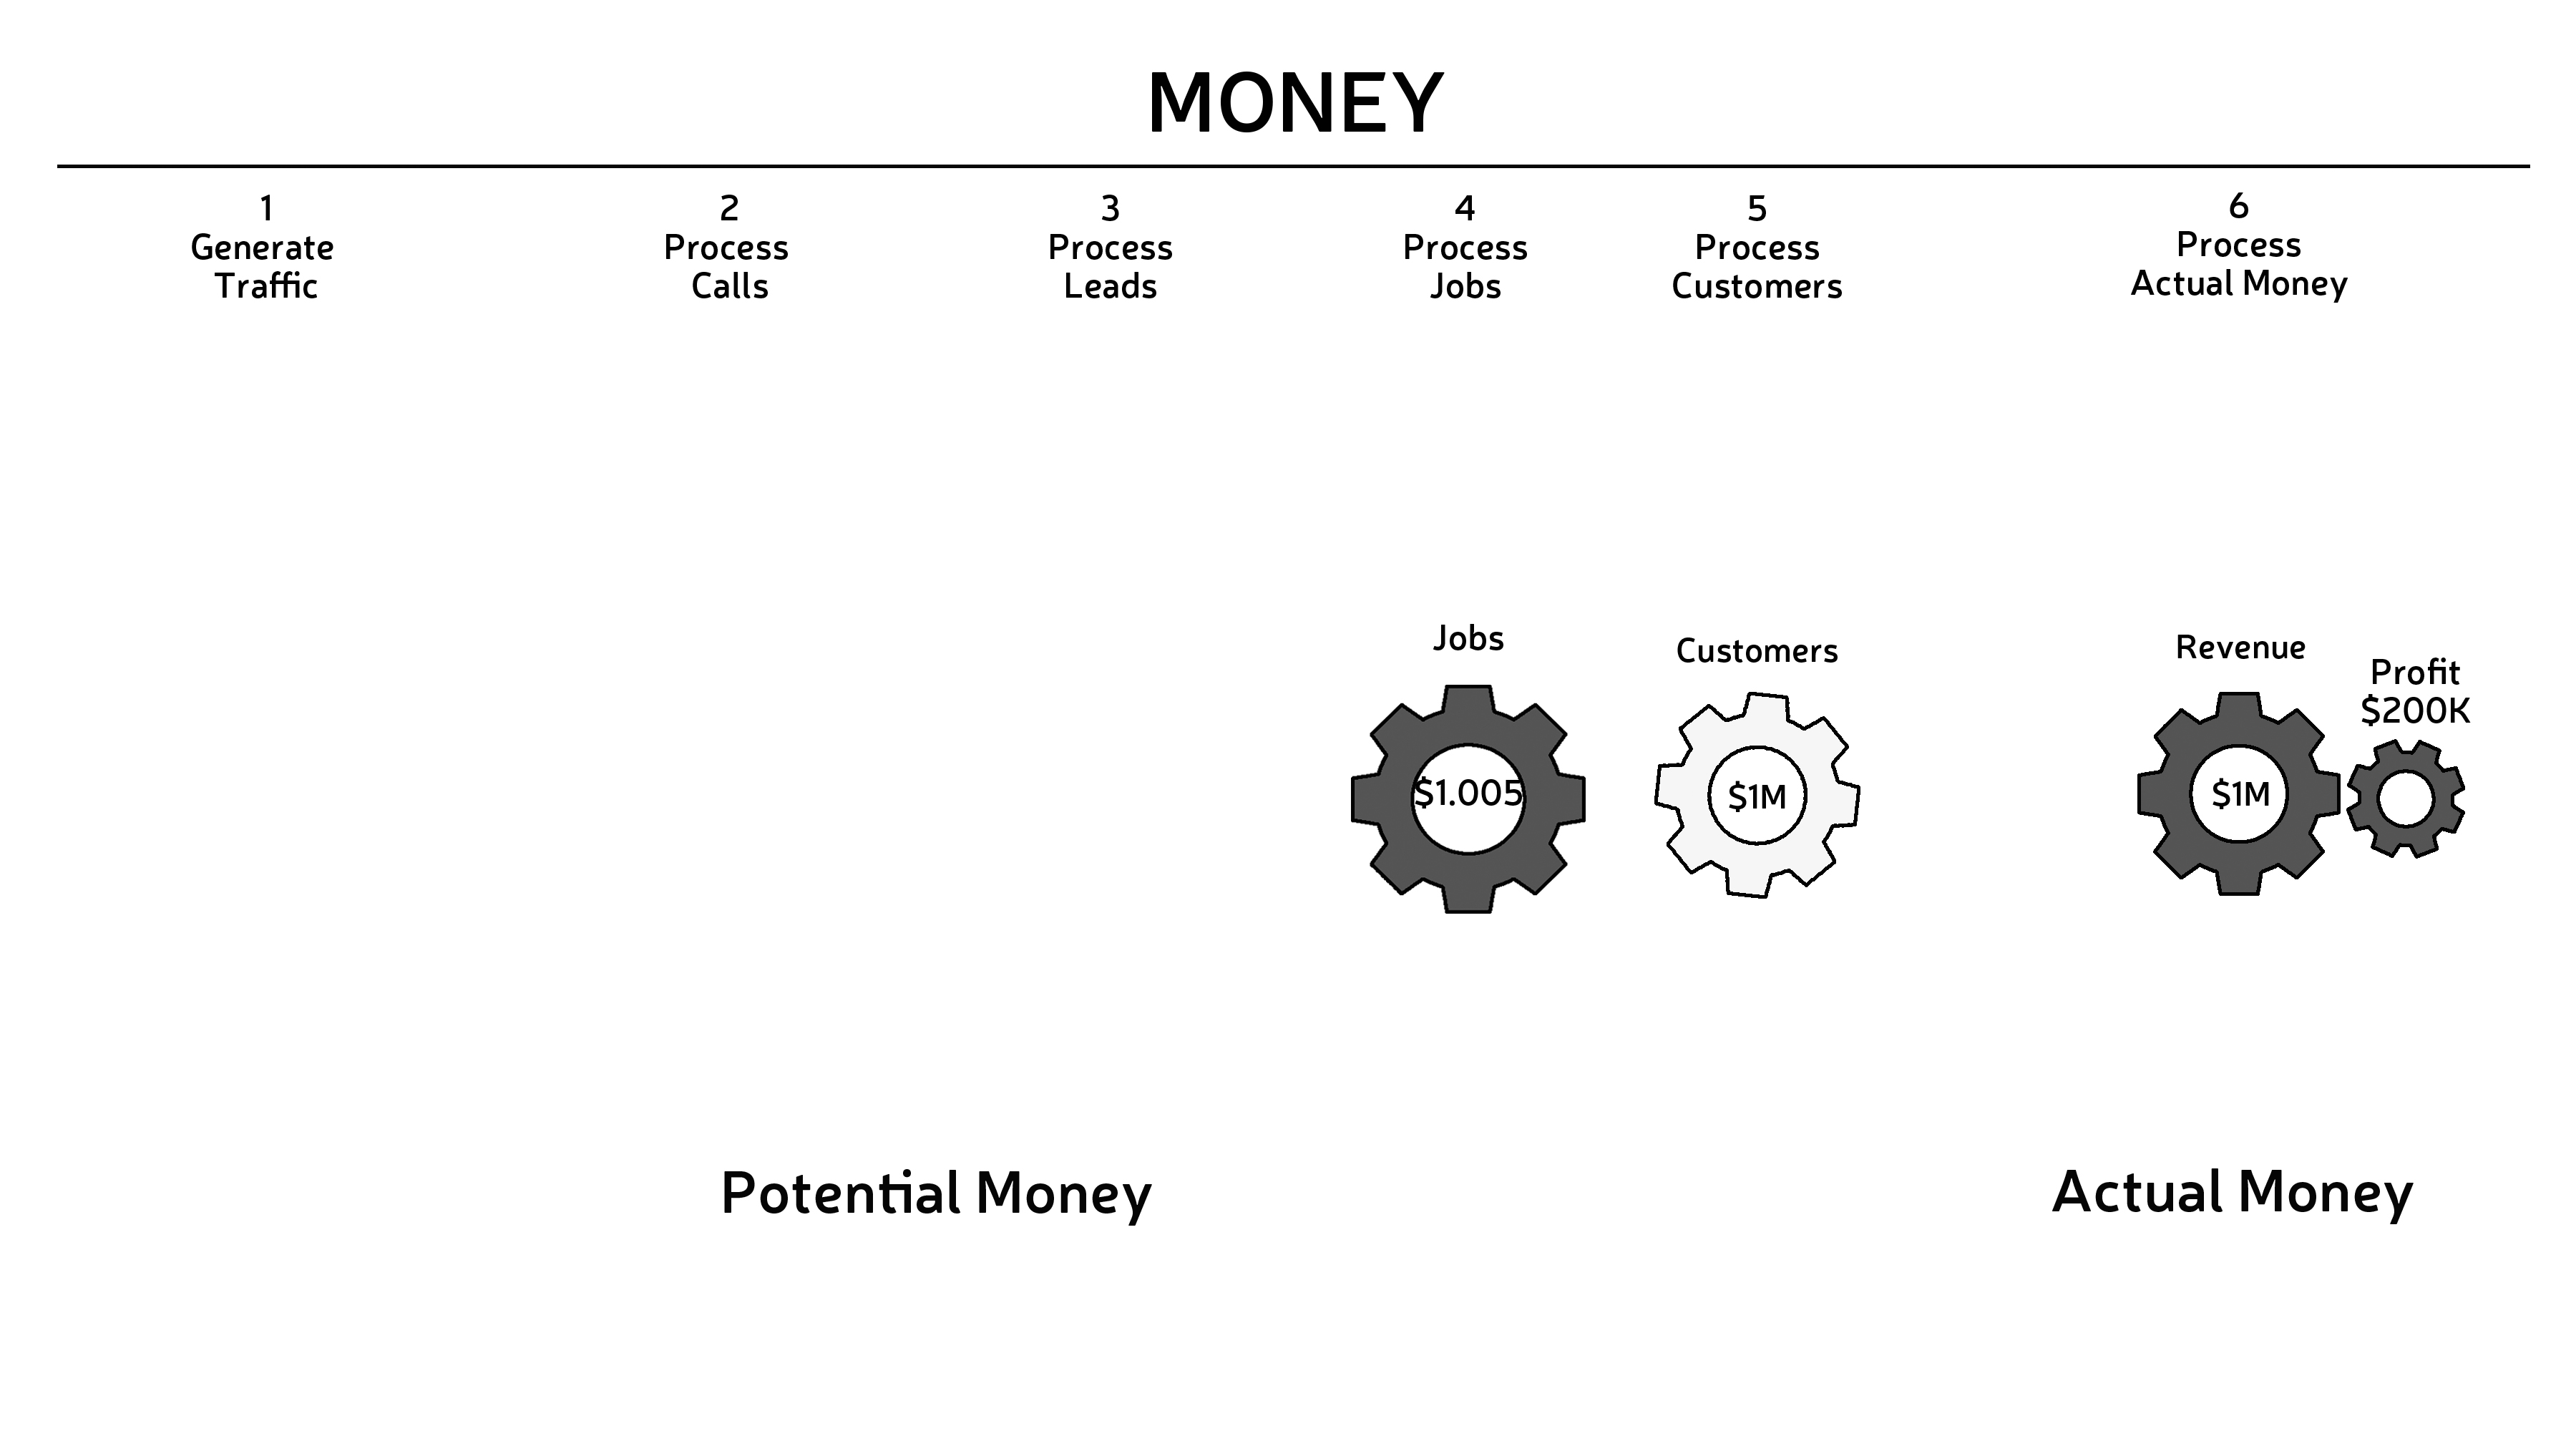 Calculate the scale of your jobs gear and add it to your model, under section 4 of your timeline, labeled “Jobs”.
Your jobs gear should be larger than your revenue gear, which is the same size as your customer gear.
LEADS
The next gear you’re going to add is the Leads gear, which represents interested persons who are qualified to buy your service or product. Now—let’s be honest with ourselves—not everyone who can purchase what we’re selling will place an order. Maybe they don’t like our estimates, or they change their minds and cancel when we arrive onsite. This means, that just as you had fewer customers than jobs, you’re going to have fewer jobs than leads. In my business, we convert 80% of our leads to jobs. So the leads gear is 1.25 the size of the jobs gear.
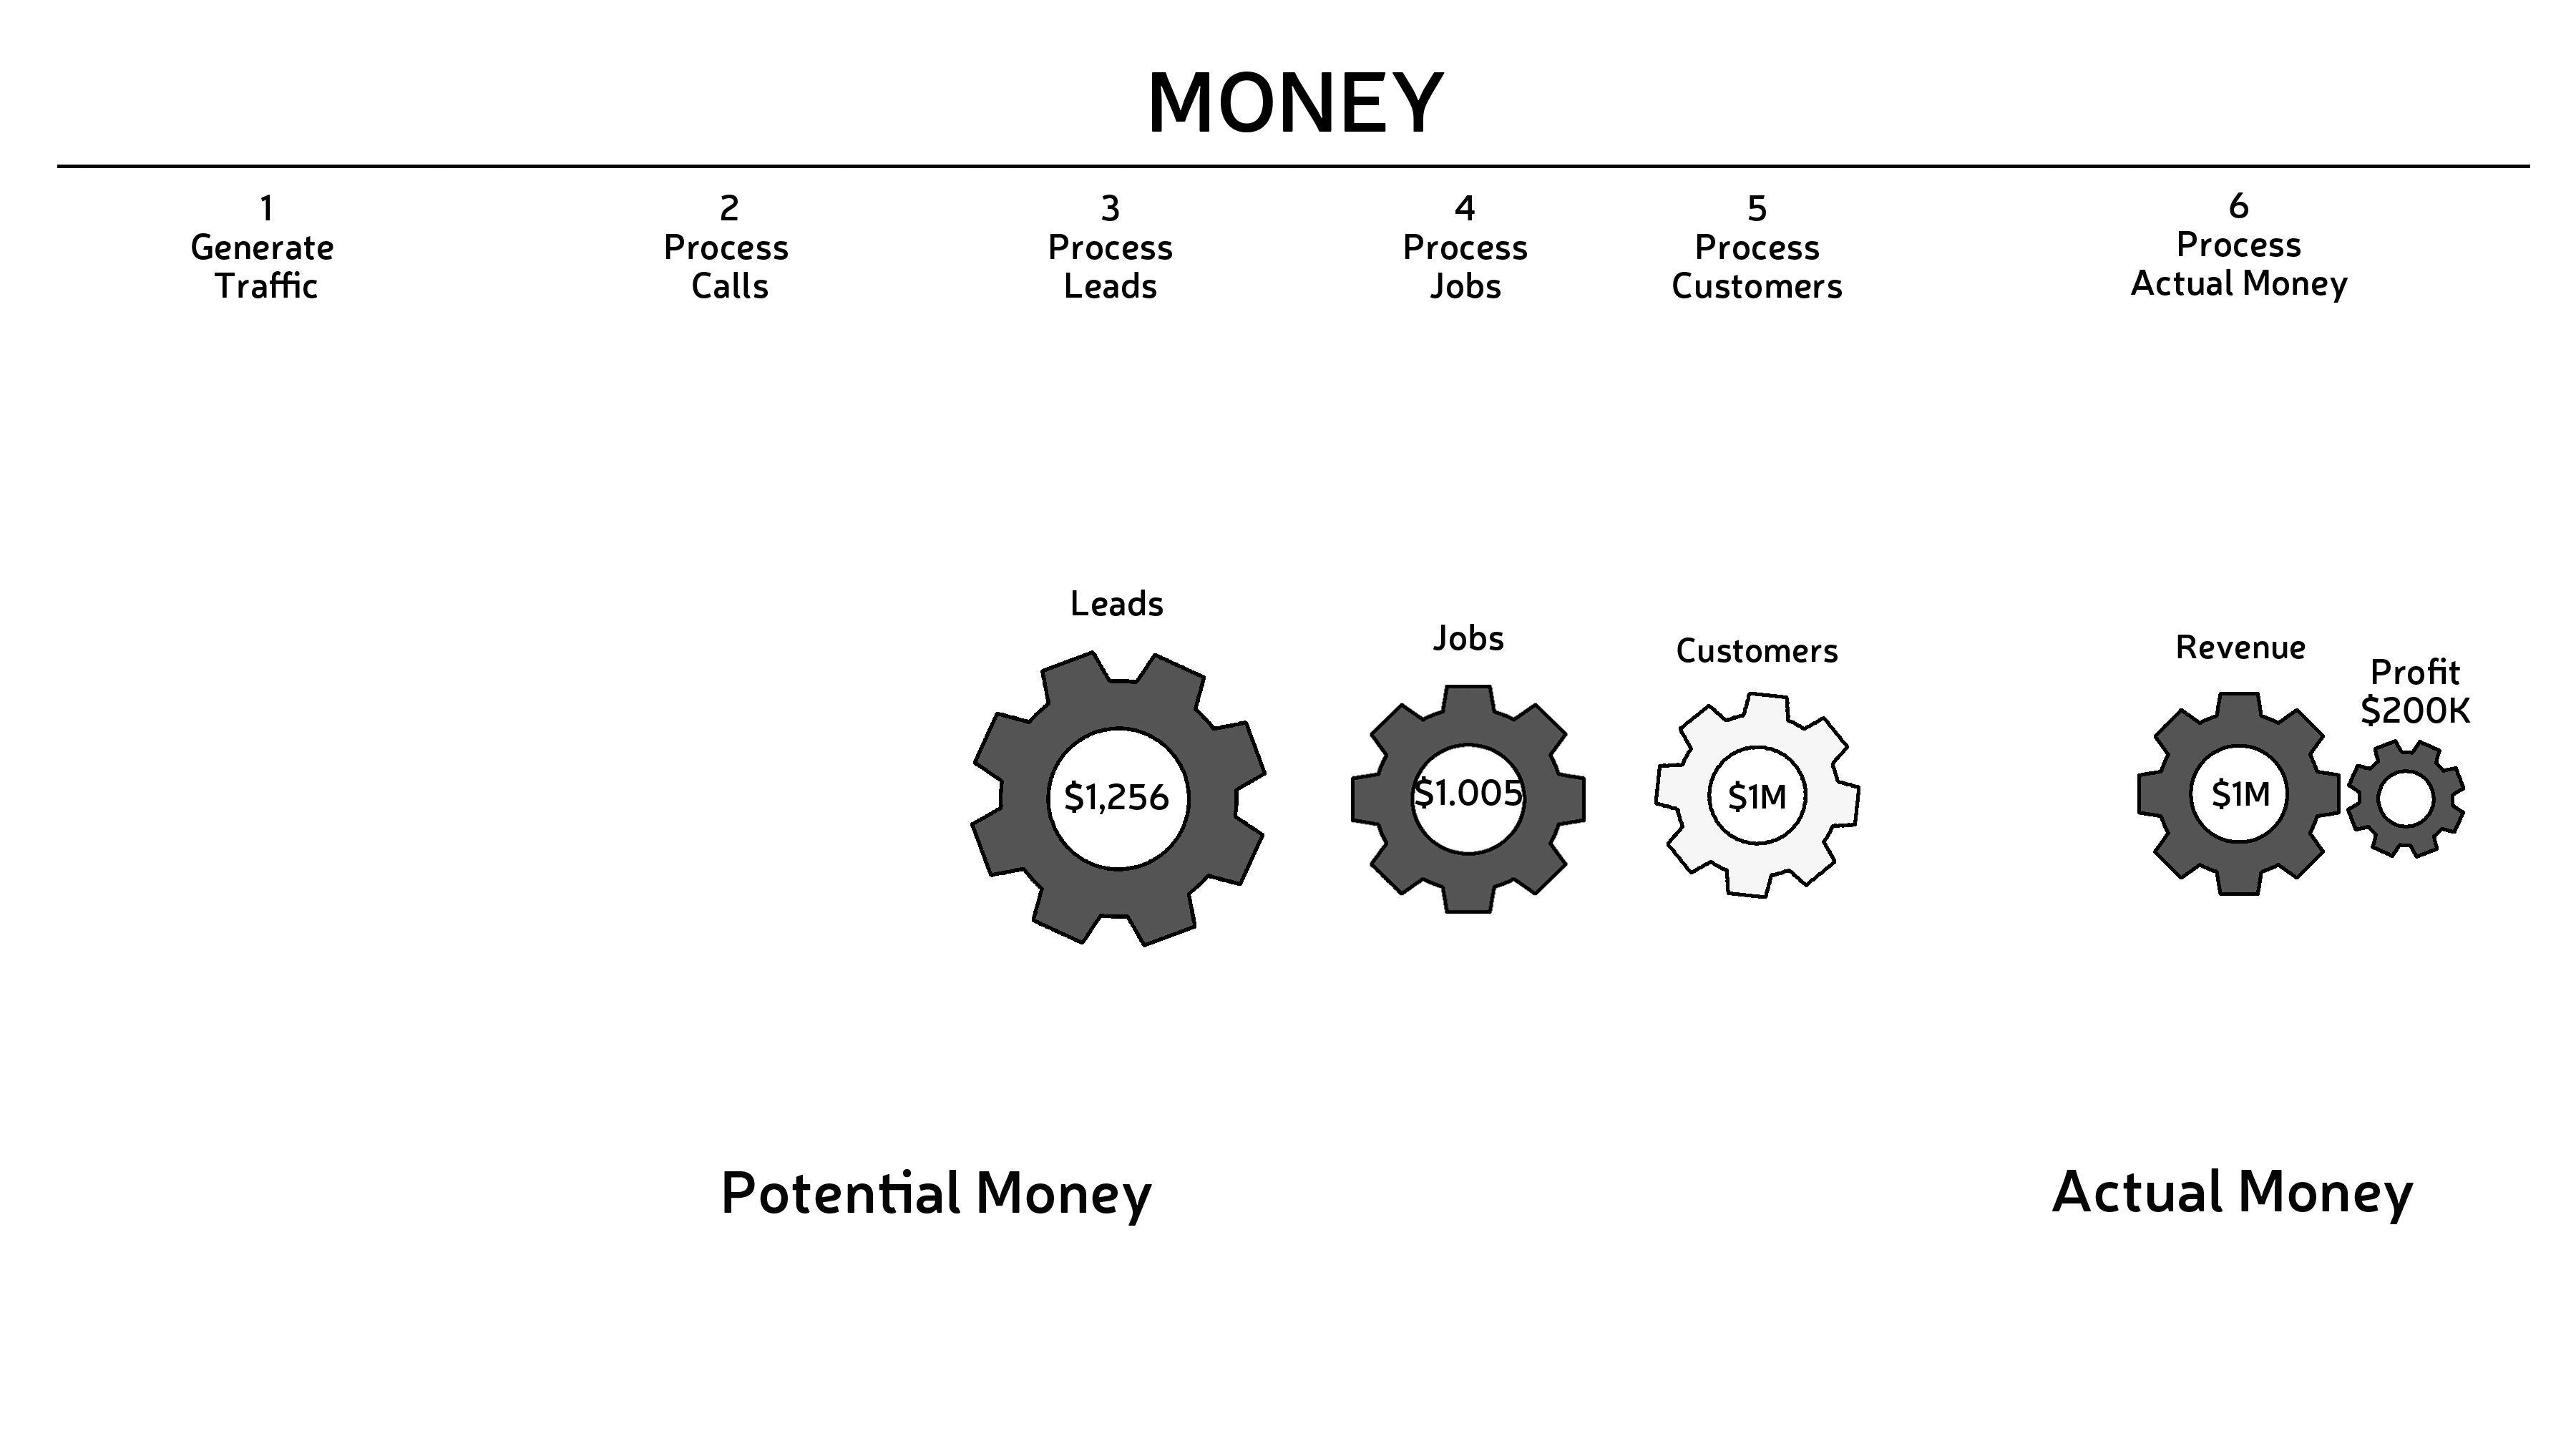 Calculate the size of your leads gear by multiplying the number of leads by the average ticket size. Place your leads gear under the appropriate section of your timeline. It should be the largest gear in your model so far.
CALLS
To the left of leads in the sales funnel is calls. Calls are the people who contact your company via phone, web, email, etc. to inquire about your product or service.
By now you can probably guess how to calculate the scale of your calls gear. Multiply the number of calls by your average ticket size. You can also probably guess that your calls gear will be bigger than your leads gear. In my GJ business, we only convert 50% of calls to leads. This means that our calls gear is 2 times the size of the leads gear.
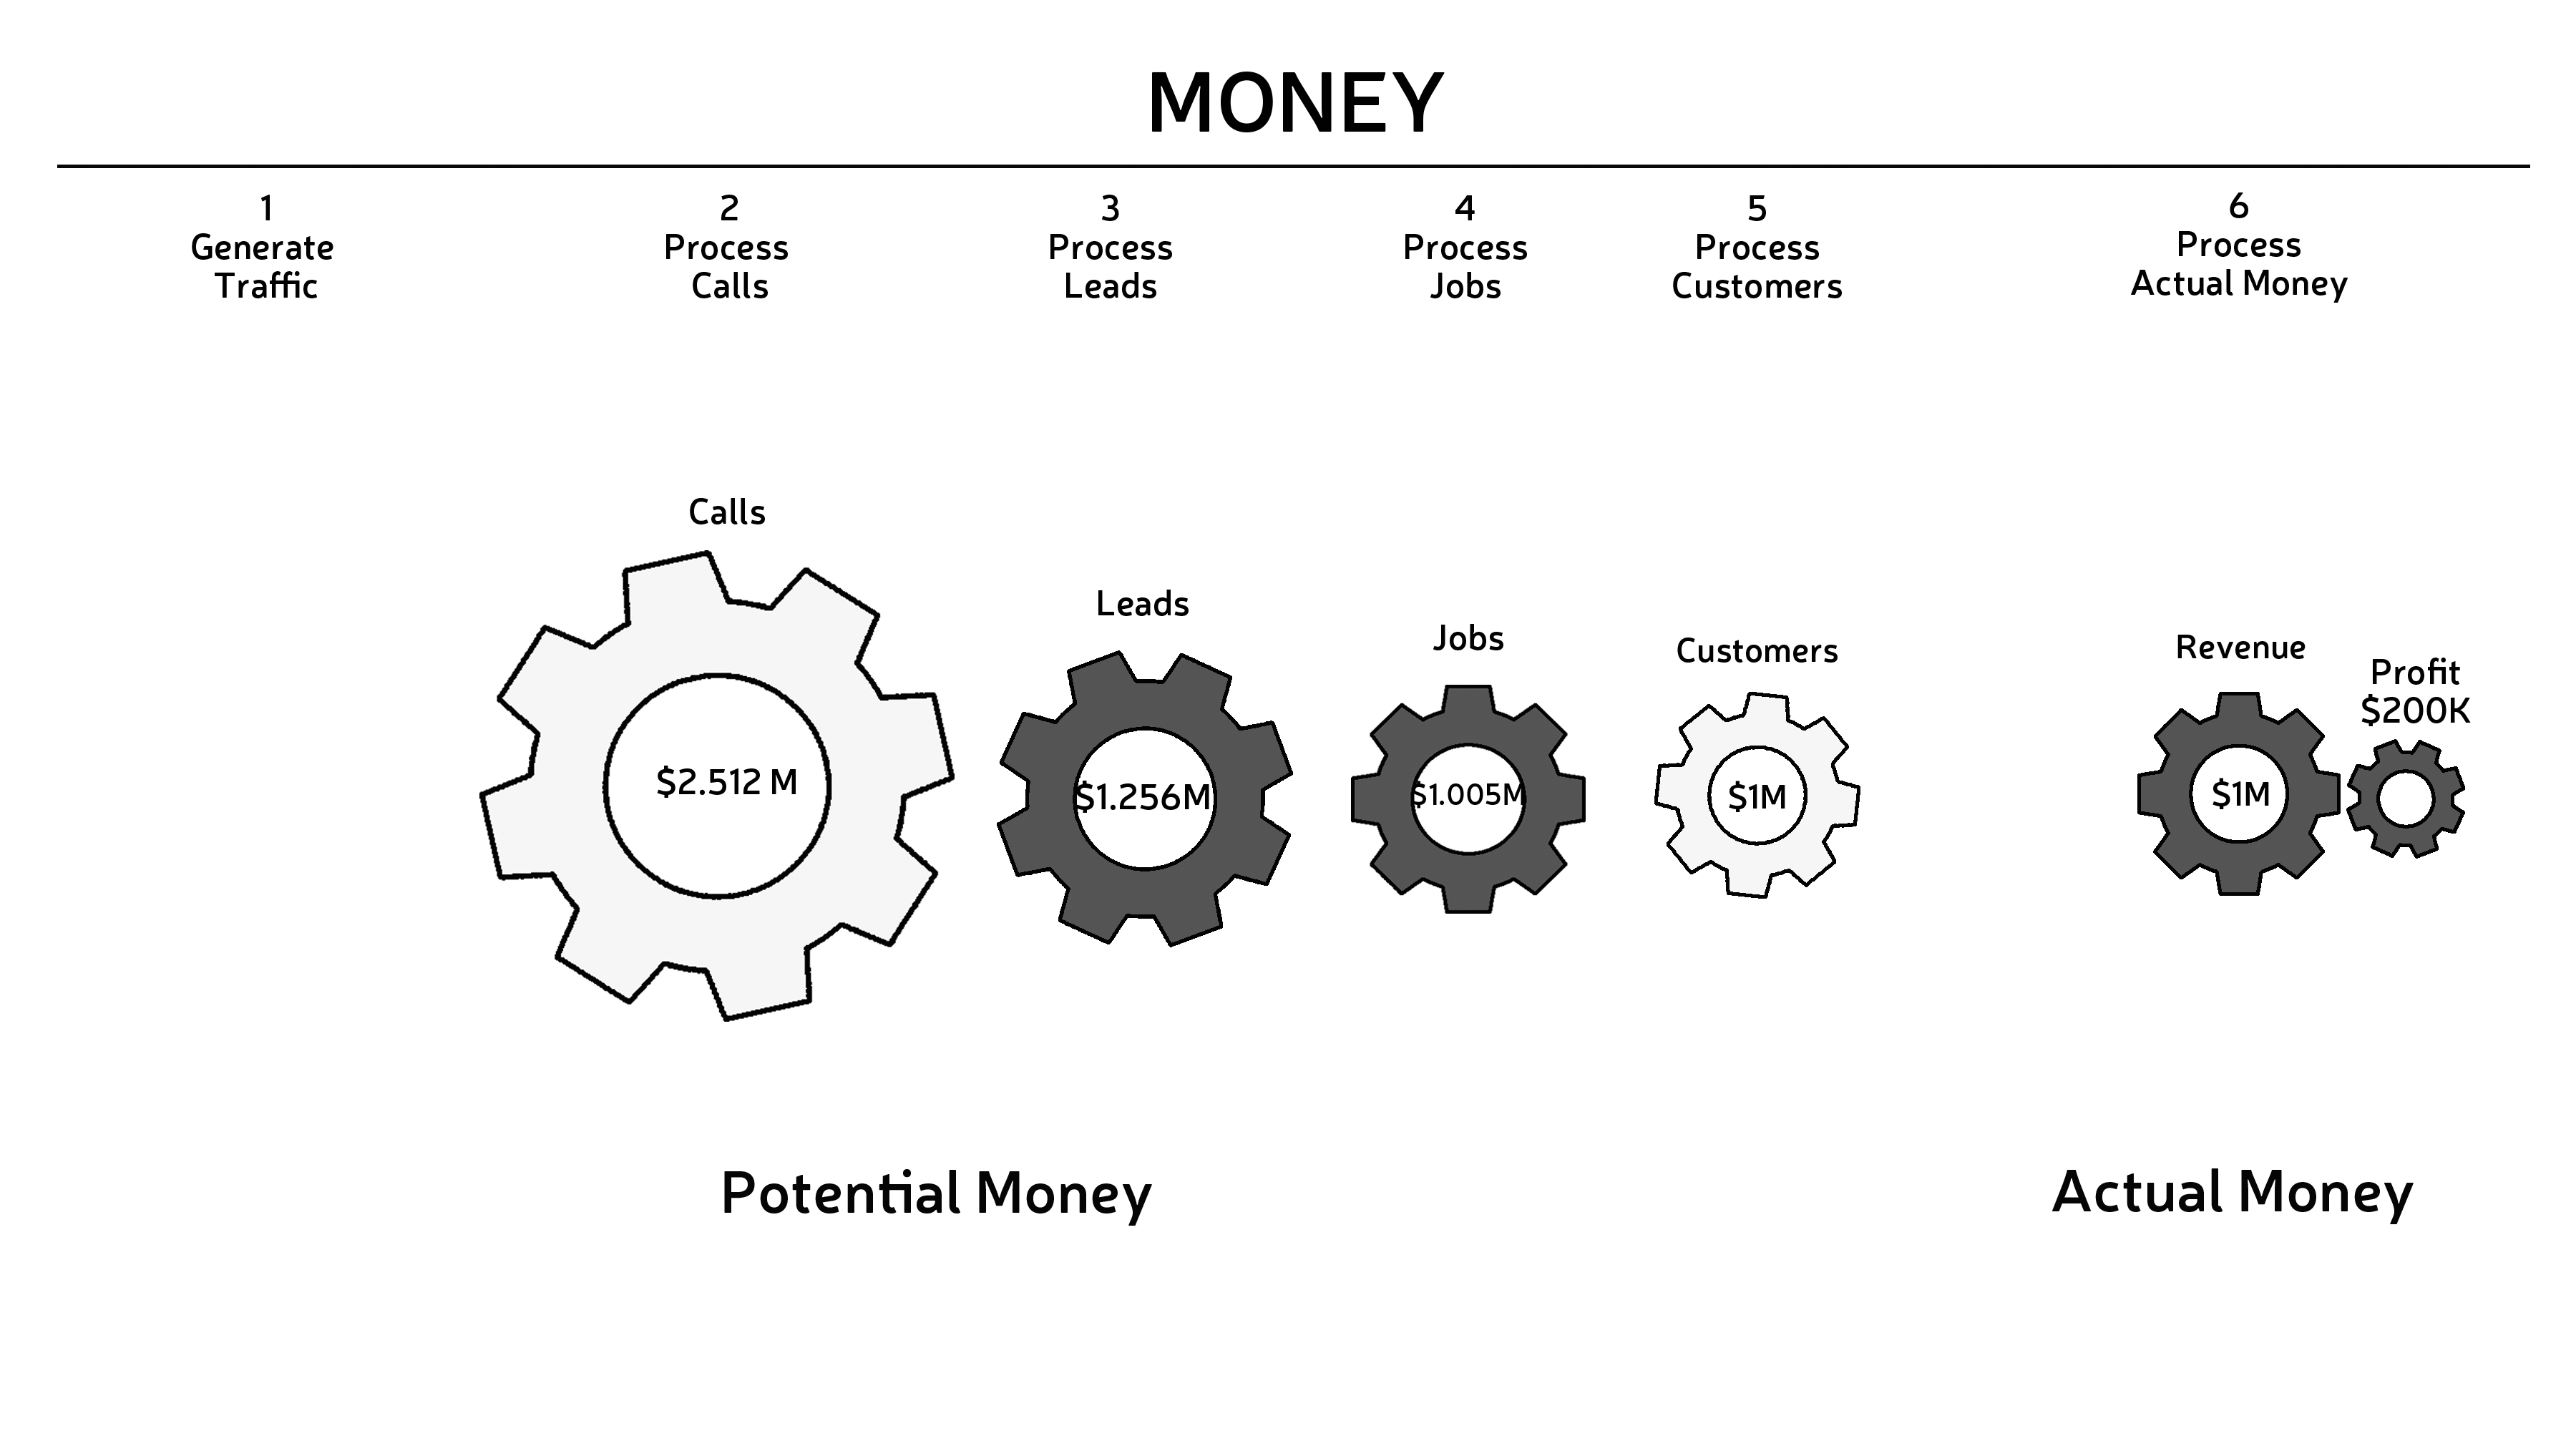 Add your calls gear to your model.
TRAFFIC
The final, leftmost gear in your model represents traffic, all the people who are impacted by your brand. This includes web hits, people who hear your ads on the radio, view your spots on TV, see your trucks on the street, etc. This gear can get really big. I’m serious. REALLY big. It could be anywhere from 100 to 10,000 times bigger than your sales gear. For example, if I were to get 1,000 web hits a day with an average job size of $400, I’d have $400 x 1,000 x 365. That’s $146,000,000 worth of traffic. This would make the traffic gear over 50x the size of my calls gear, which is only worth $2,512,500. This would make it fairly impossible to represent the whole model legibly at one time. In this case, I might replace the gear with the number value. Like this:
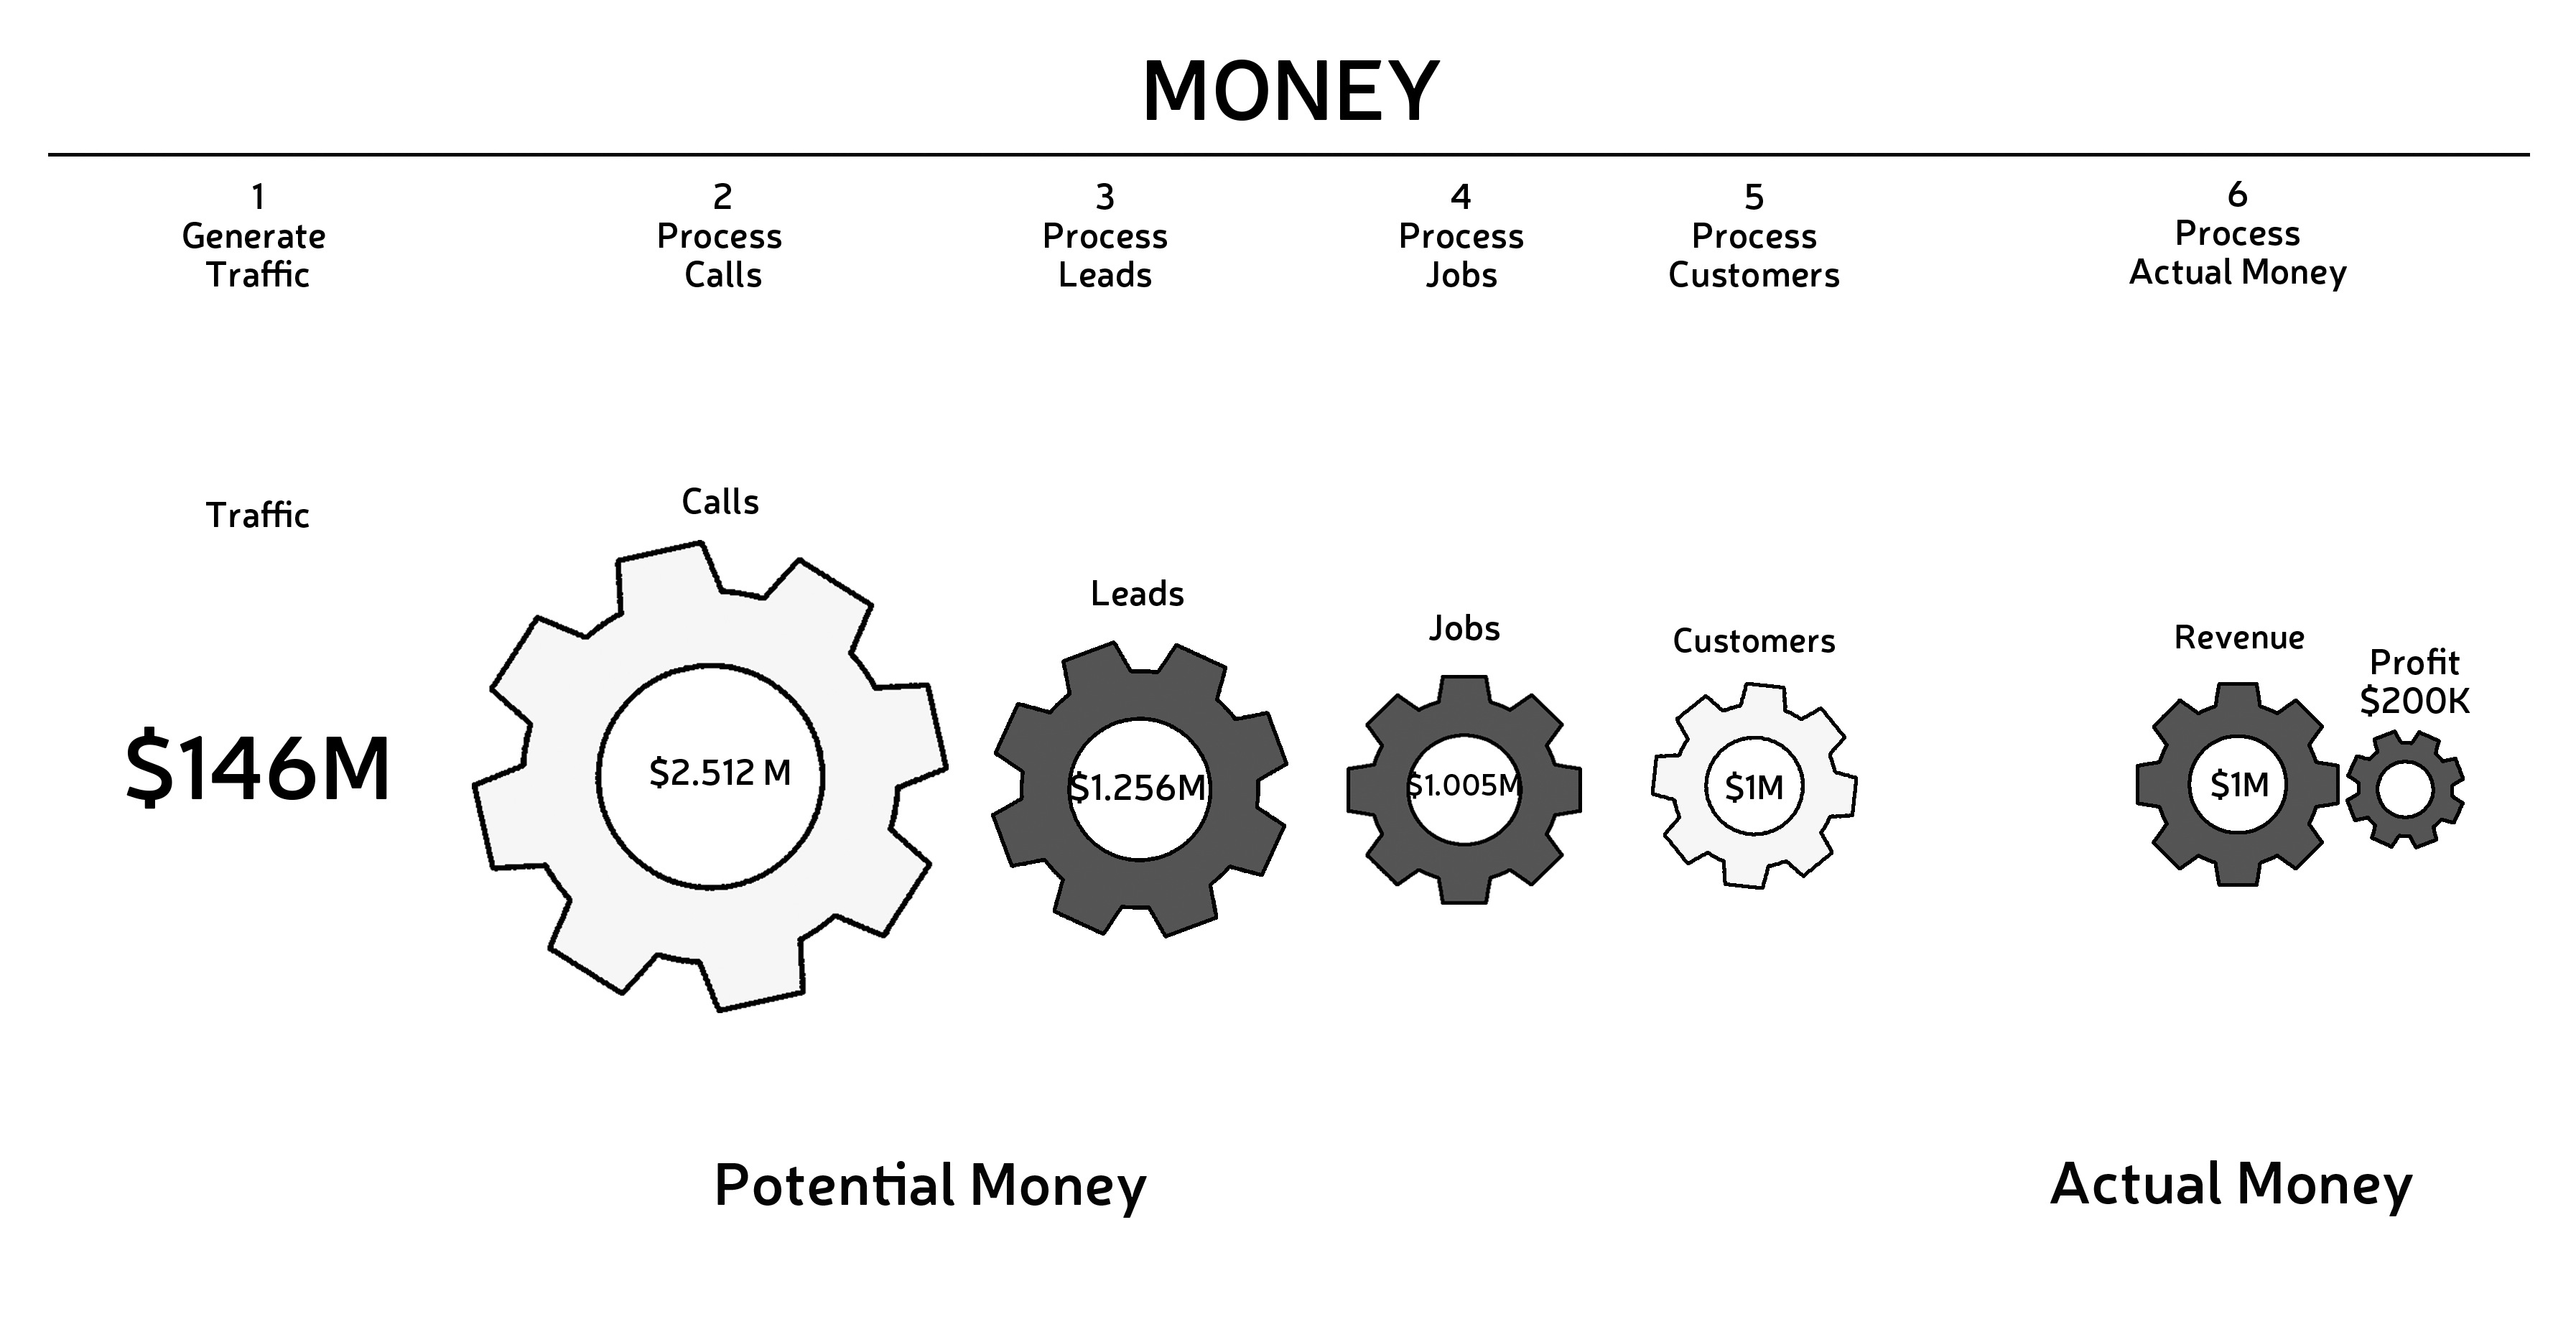
Determine the scale of your traffic gear by multiplying the number of people you reach by your average ticket size, and add it to the model.
It should come as no surprise that your traffic gear is the biggest gear yet.
STEP 4: ACCOUNT FOR CONVERSION COSTS
What the previous steps make clear is that as you move left to right through your sales funnel you’re losing potential customers—and potential revenue. But you’re also losing actual money on the resources—staff, services, materiel—required for the conversion processes. These costs are represented by another set of smaller gears in between each of your main gears.
 I didn’t include the conversion gears in my lemonade stand example because Lisa was presumably doing all of the work herself and not taking a salary. It didn’t cost her anything to convert traffic to customers
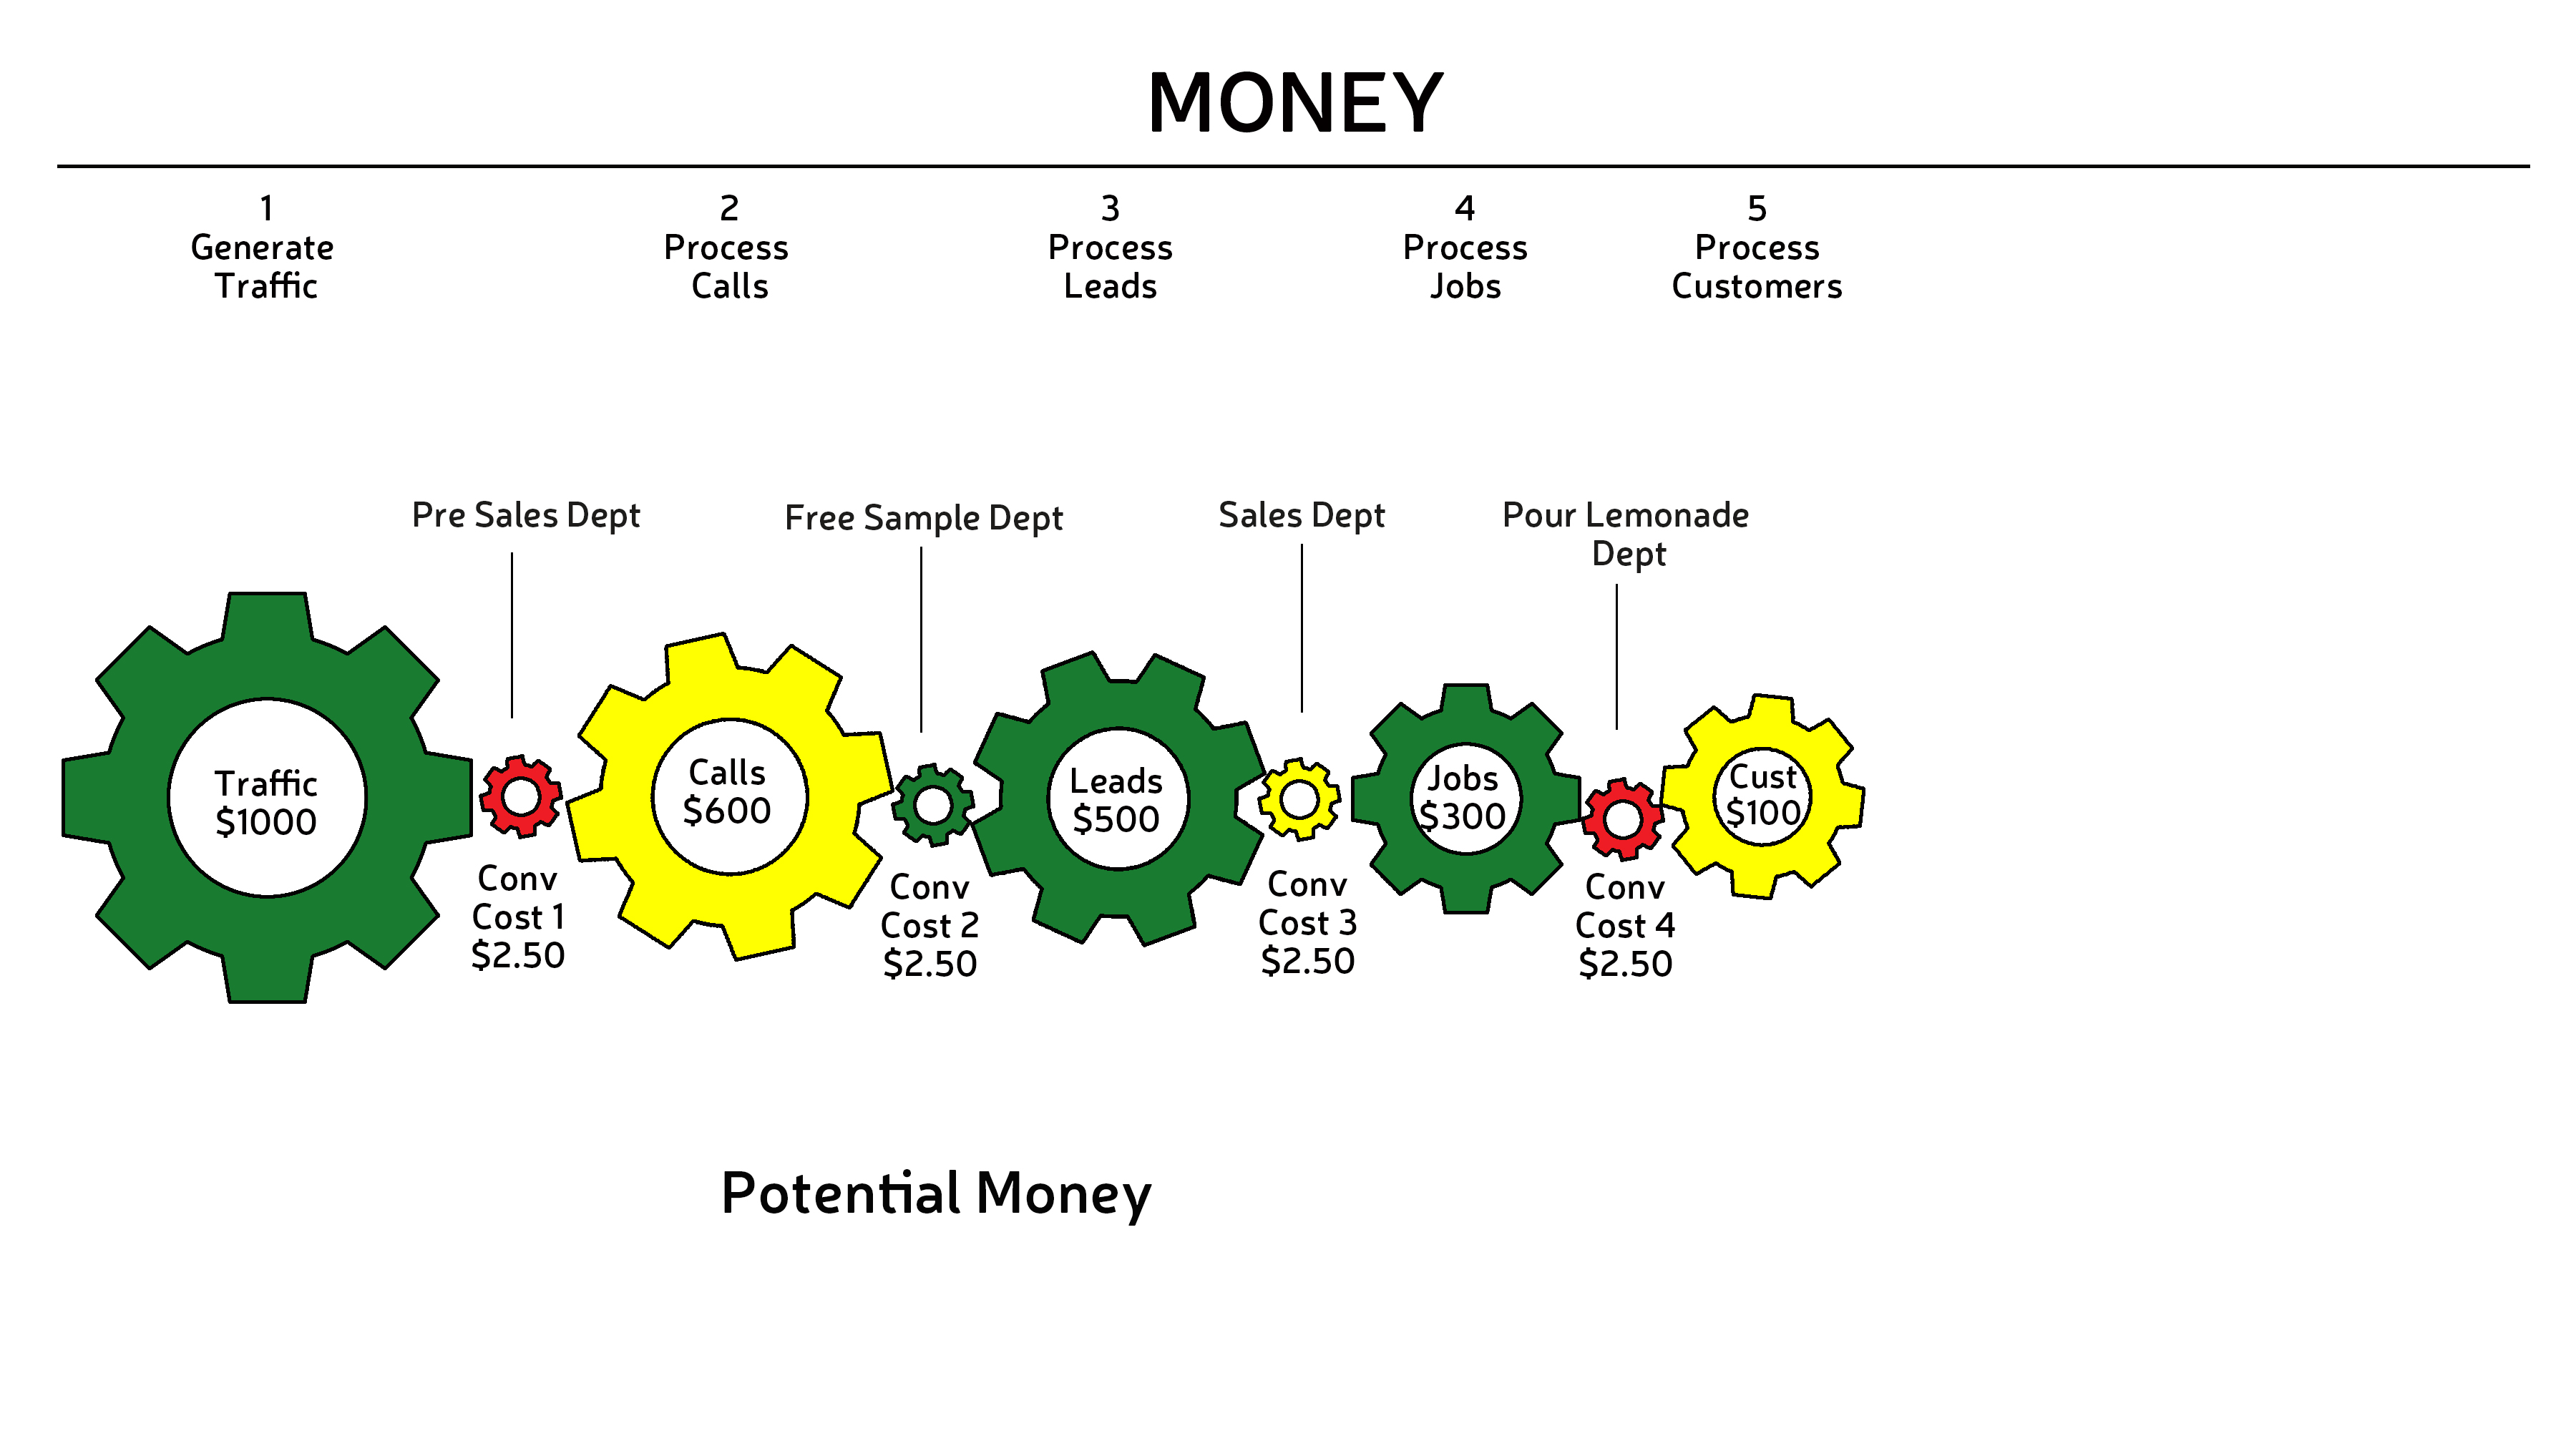
But let’s say Lisa wants to take weekends off. She still wants the stand to operate in her absence, so she hires her friend Sam to work Saturdays and Sundays. Sam will be paid $10/hour to convince traffic to call on the stand by being friendly, convert calls into leads by asking them if they are thirsty, convert leads into jobs by serving them lemonade, and convert jobs into customers by taking payments. In the course of the day, Sam spends 15 minutes on each of these four activities. Sam’s total conversion cost for a day, then, is $10—with $2.50 spent on each activity. I determine the scale of the conversion cost gears accordingly, color code them based on my budget, and add them to the lemonade stand model:
 Unlike Lisa, you probably have multiple employees. So let’s take a look at what might happen if Lisa’s business were to grow exponentially.
Lisa’s business has become so successful that she’s brought twenty new employees on board—her entire third grade class. She doesn’t need all twenty employees do every job, so she divides them into groups of five employees each—marketing, sales, servers, and cashiers. Lisa would have several options for visualizing her conversion costs.
She could lump all her costs at each conversion point together and represent each with a single gear:
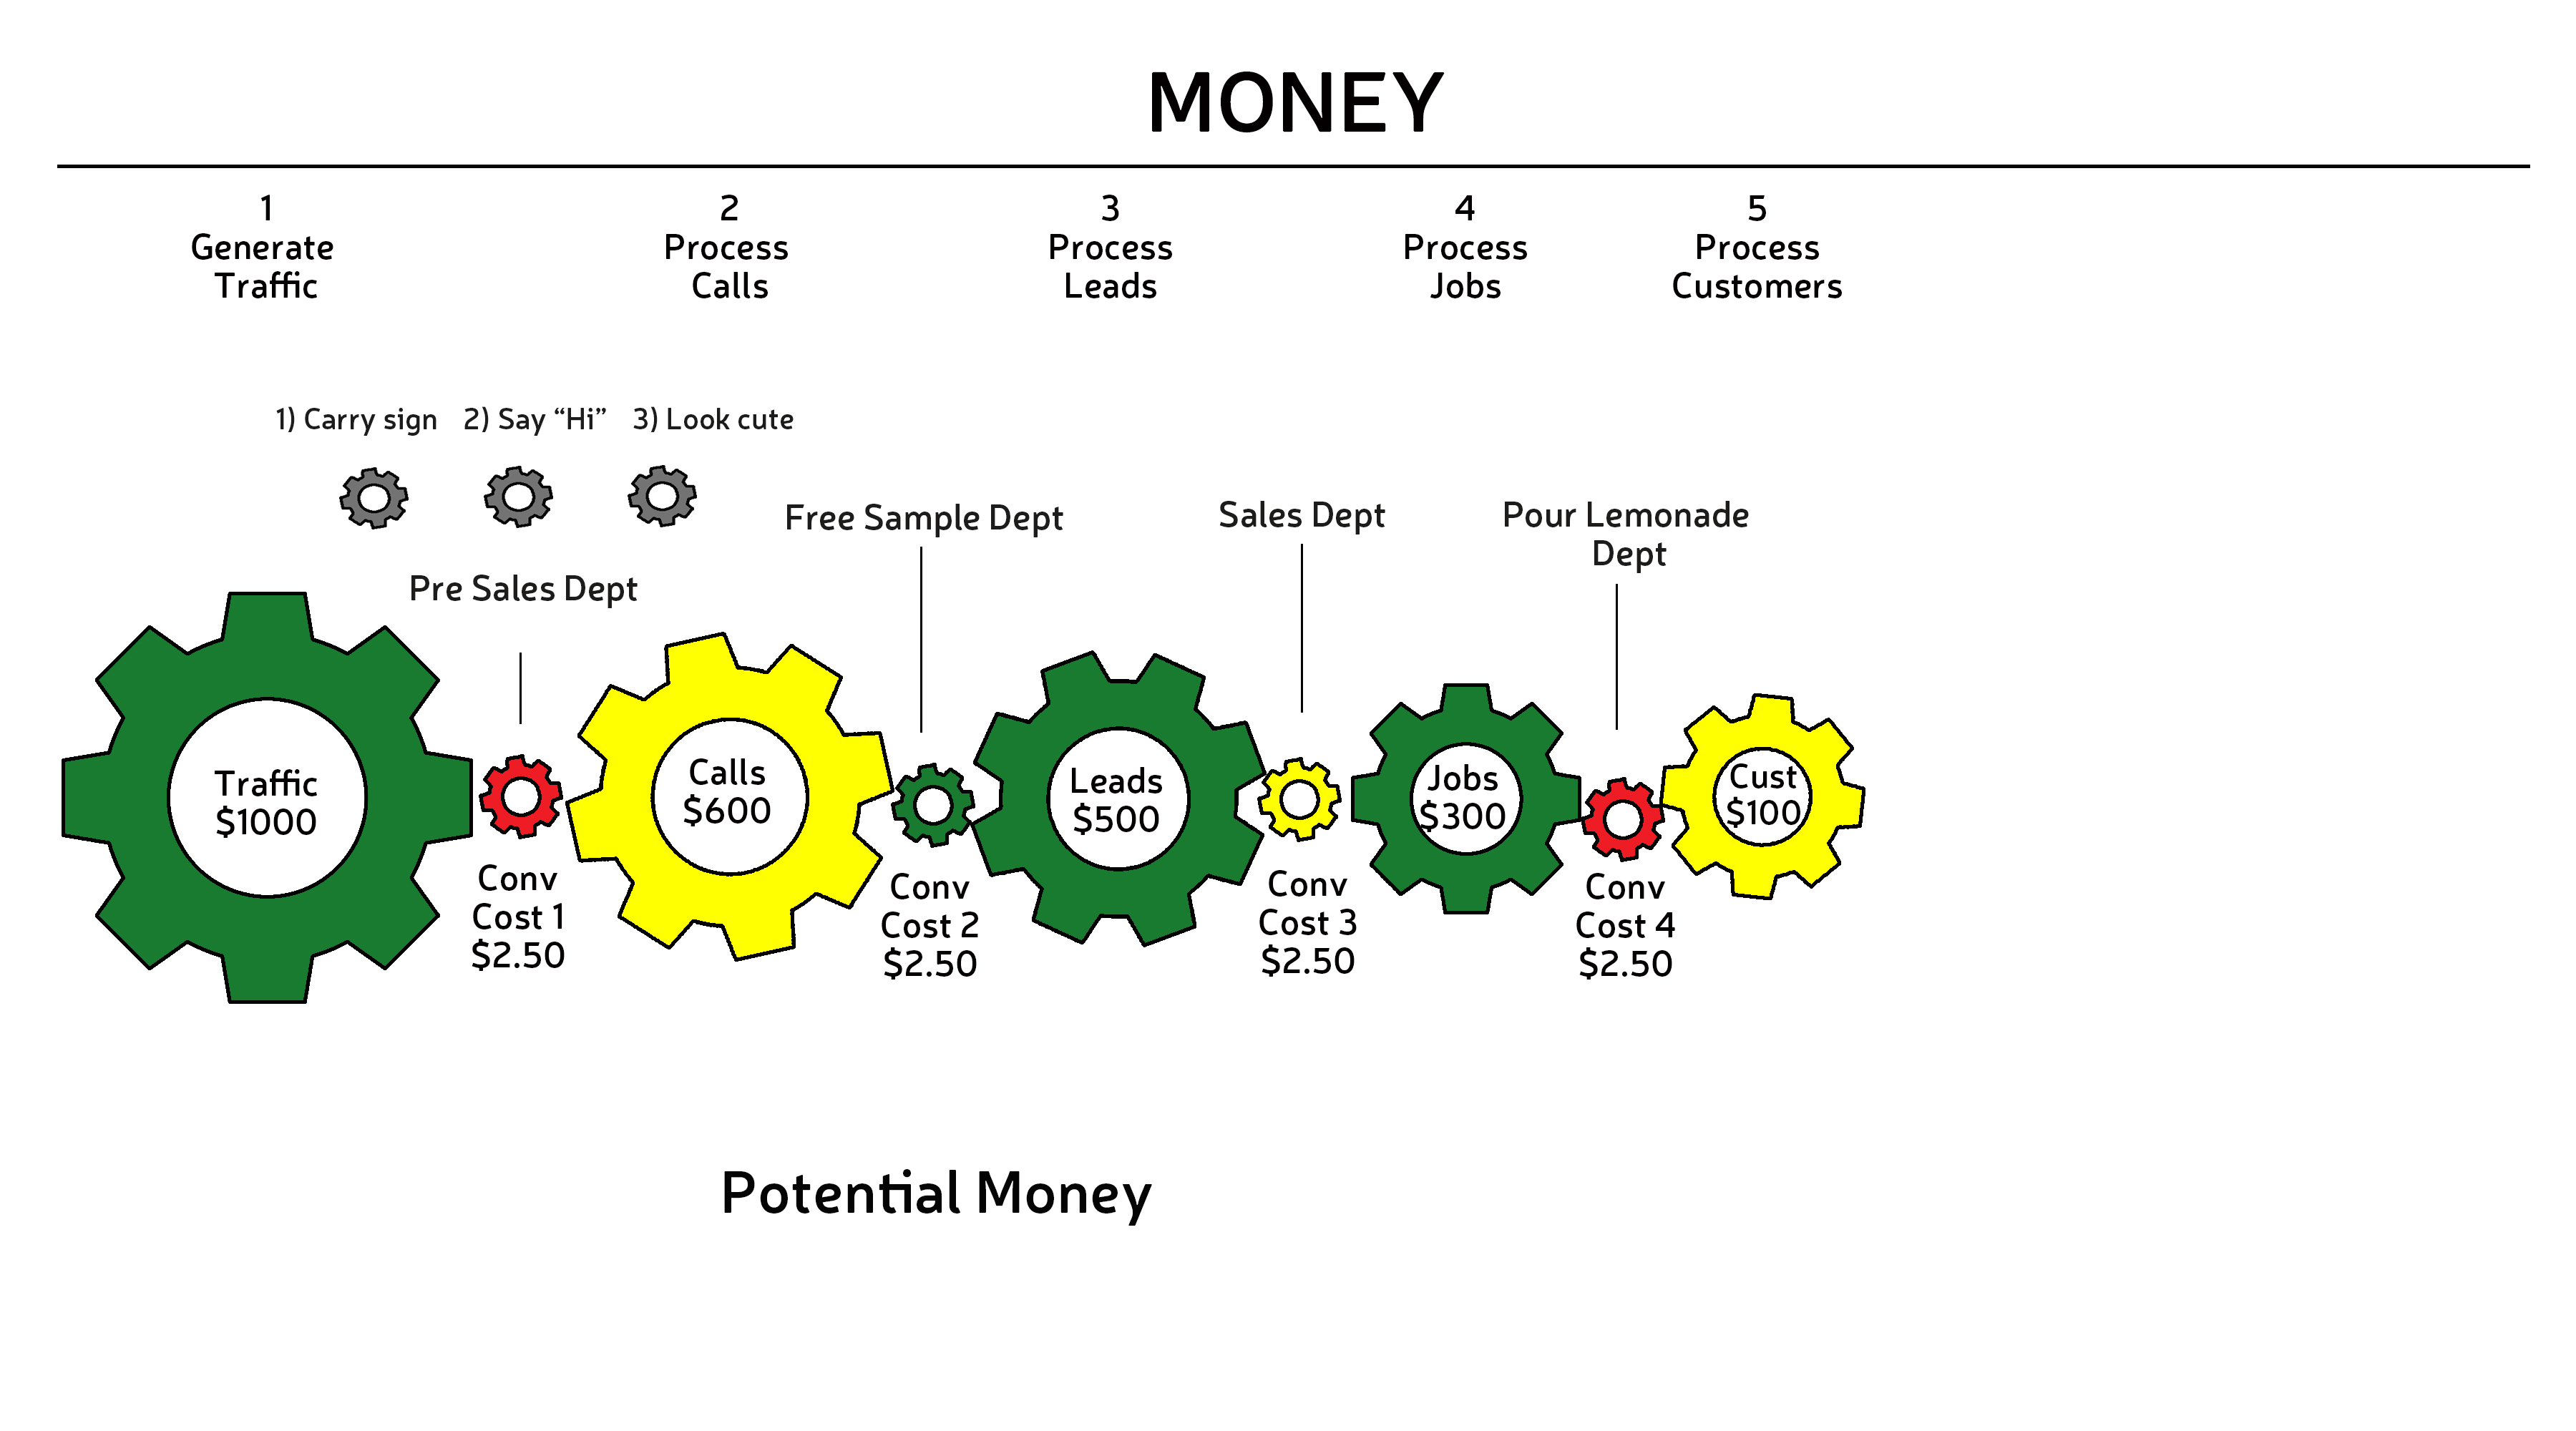
 But, if she wanted an even more detailed picture, Lisa could break down her departments into job functions or tasks. For example, let’s say her pre-sales department has three responsibilities:
- Walk around with a sign
- Say “hi” to people
- Engage with potential customers
She might represent those three job functions separately and scale them accordingly. If she were spending an equal amount on all three jobs, her model would look like this:
 Finally, Lisa could divvy up job functions or tasks by individual employee and scale her gears based on those costs to get something like this:
 Follow me so far?
Now let’s return to your model. The next step is to decide how finely you want to granulate your conversion costs (to the process, department, job function, or employee level) then calculate the scale of the gear for each and add it to your model. If you have conversion cost expenses other than employee compensation, make sure to represent those as gears as well. For example, your company takes credit cards for payment and each transaction costs you 3% of sales. This 3% conversion cost should be added to the gear between Jobs and Customers.
By now you may have the following question: Why, if we’re paying staff for their work in the conversion process, do those costs appear on the Potential Money side of our model. Why do we still have a “Staff” gear on the Actual Money side?
Short answer: Not all of the work is related to conversion. If you have staff, some of their jobs are related to conversion but not all of them are. In addition to the conversion costs, for instance, Lisa might need people to:
- Buy materials to build the lemonade stand
- Build the lemonade stand
- Transport the lemonade stand
- Setup the lemonade stand
- Breakdown the lemonade stand
Longer answer: Your conversion costs = the percentage of staff wages and job function costs directly related to converting potential money into actual money. The rest of the staff wages are related to other job functions across the business.
The same holds true for material costs related to conversion. A credit card transaction fee is a conversion cost. Electricity and wireless service in your building are not. Those costs are represented as gears on the right side of the model.
STEP 5: COLOR CODE THEORETICAL MONEY
The fifth step in the modeling process is where we begin to visualize how well—or how poorly—our system is performing. This is where we go Technicolor. Before we do, make sure to have your budget handy. That’s the palette you’ll need to color code your gears.
Every gear in your money model should correspond to a specific line item in your budget. Look through each line and color your gears as follows:
STEP 6: TRACK THE FLOW OF MONEY
Now that our timeline and gears are in place, correctly scaled and aptly colored, we’re ready to put our models in motion. By adding rotation and speed, you’ll be able to see at a glance where your business engine is reaping—or seeping—money.
If you’ve been building your model on a computer and have animation skills, this part will be pretty easy. If you’ve been working on paper, you’ll have to get a little creative.
ROTATION
At each point on your timeline, money is flowing through your business engine. Sometimes money is coming in and sometimes it’s going out. The direction in which your gears rotate will tell you whether money is entering or leaving the system.
So, let’s get a move on.
Some gears spin counter-clockwise and some in clockwise motion.
 Revenue, obviously, represents money in. So your revenue gear should turn counter-clockwise. Expenses are money out. Those gears turn clockwise. Components on the sales funnel represent money coming into the system, so—right you are!—counter-clockwise. Conversion costs are going out—clockwise. Oh, and because profit is money that you’ll eventually spend, the profit gear spins clockwise as well.
You get the picture.
[TIP: If you’ve been drawing or working with cut-outs, try indicating rotational direction with arrows as shown above.]
SPEED
Now that you’re gears are spinning, you’ll want to adjust their speed. The speed at which each gear spins is determined by how fast money is being made or spent. Depending on the type of business you have, this might be measured in dollars per day or dollars per hour.
Starting with your revenue gear, divide the total dollar value by the hours worked per day times the number of days worked per year. For example, if your business does $1M in sales and it operates 10 hours a day 365 days a year, the equation for rotational speed of the revenue gear would be:
$1,000,000 / (10 x 365) = $274 dollars per hour
Now set a speed to represent the solution (in the example above $274 dollars per hour). As with the size of the gears, the rotational speed of all other gears will be proportional to the speed of this revenue gear. The ratios will be the same for speed as they are for scale.
[TIP: If you’ve been working on paper, drawing or with cut-outs, write the dollar value per hour or day on or above its respective gear.]
TIME IS MONEY
The final moving piece in your money model is a dollar sign, which travels along the timeline and shows the duration of the “sales cycle” that you determined for your model. The speed of this dollar sign is estimated according to the time it takes to complete each process on the timeline.
For example: Ever the plucky entrepreneur, young Lisa sets up her lemonade stand at a soccer match on a hot day. There are 100 people watching the game. Lisa would want to ask herself, How long on average:
— will it take the average person to walk up to the stand (Traffic)? Estimate: 10 minutes.
— will it take to chat up that person before pitching Lemonade (Calls)? Estimate: 1 minute.
— will she take to respond (Leads)? Estimate: 10 seconds.
— will it take to make, pour, and serve a cup of lemonade (Jobs)? Estimate: 20 seconds.
— will it take to process payment and give back change (Customers)? Estimate: 10 seconds.
So, on average, the estimated time it takes to go from Traffic to Customer is: 600 + 60 + 10 + 20 + 10 seconds. Or 700 seconds. This is how long it should take her dollar sign to move across the sales funnel in her model.
According to our model, if Lisa sells lemonade for a respectable 8 hours she can expect to sell a maximum of 8*60*60 / 700 or 308 cups of lemonade. At a buck a cup, the most revenue she can generate is $308.
Given her 19% net, Lisa’s looking at a profit of $58.52.
Optimization lesson here? To make more, she would need to either shorten her sales cycle OR charge more for her delicious beverage.
Time is money.
A CHAIN IN THE ENGINE
Now that you’ve got your business engine model fueled and running, let’s throw a chain in the works. Don’t worry. It’s all part of the power train.
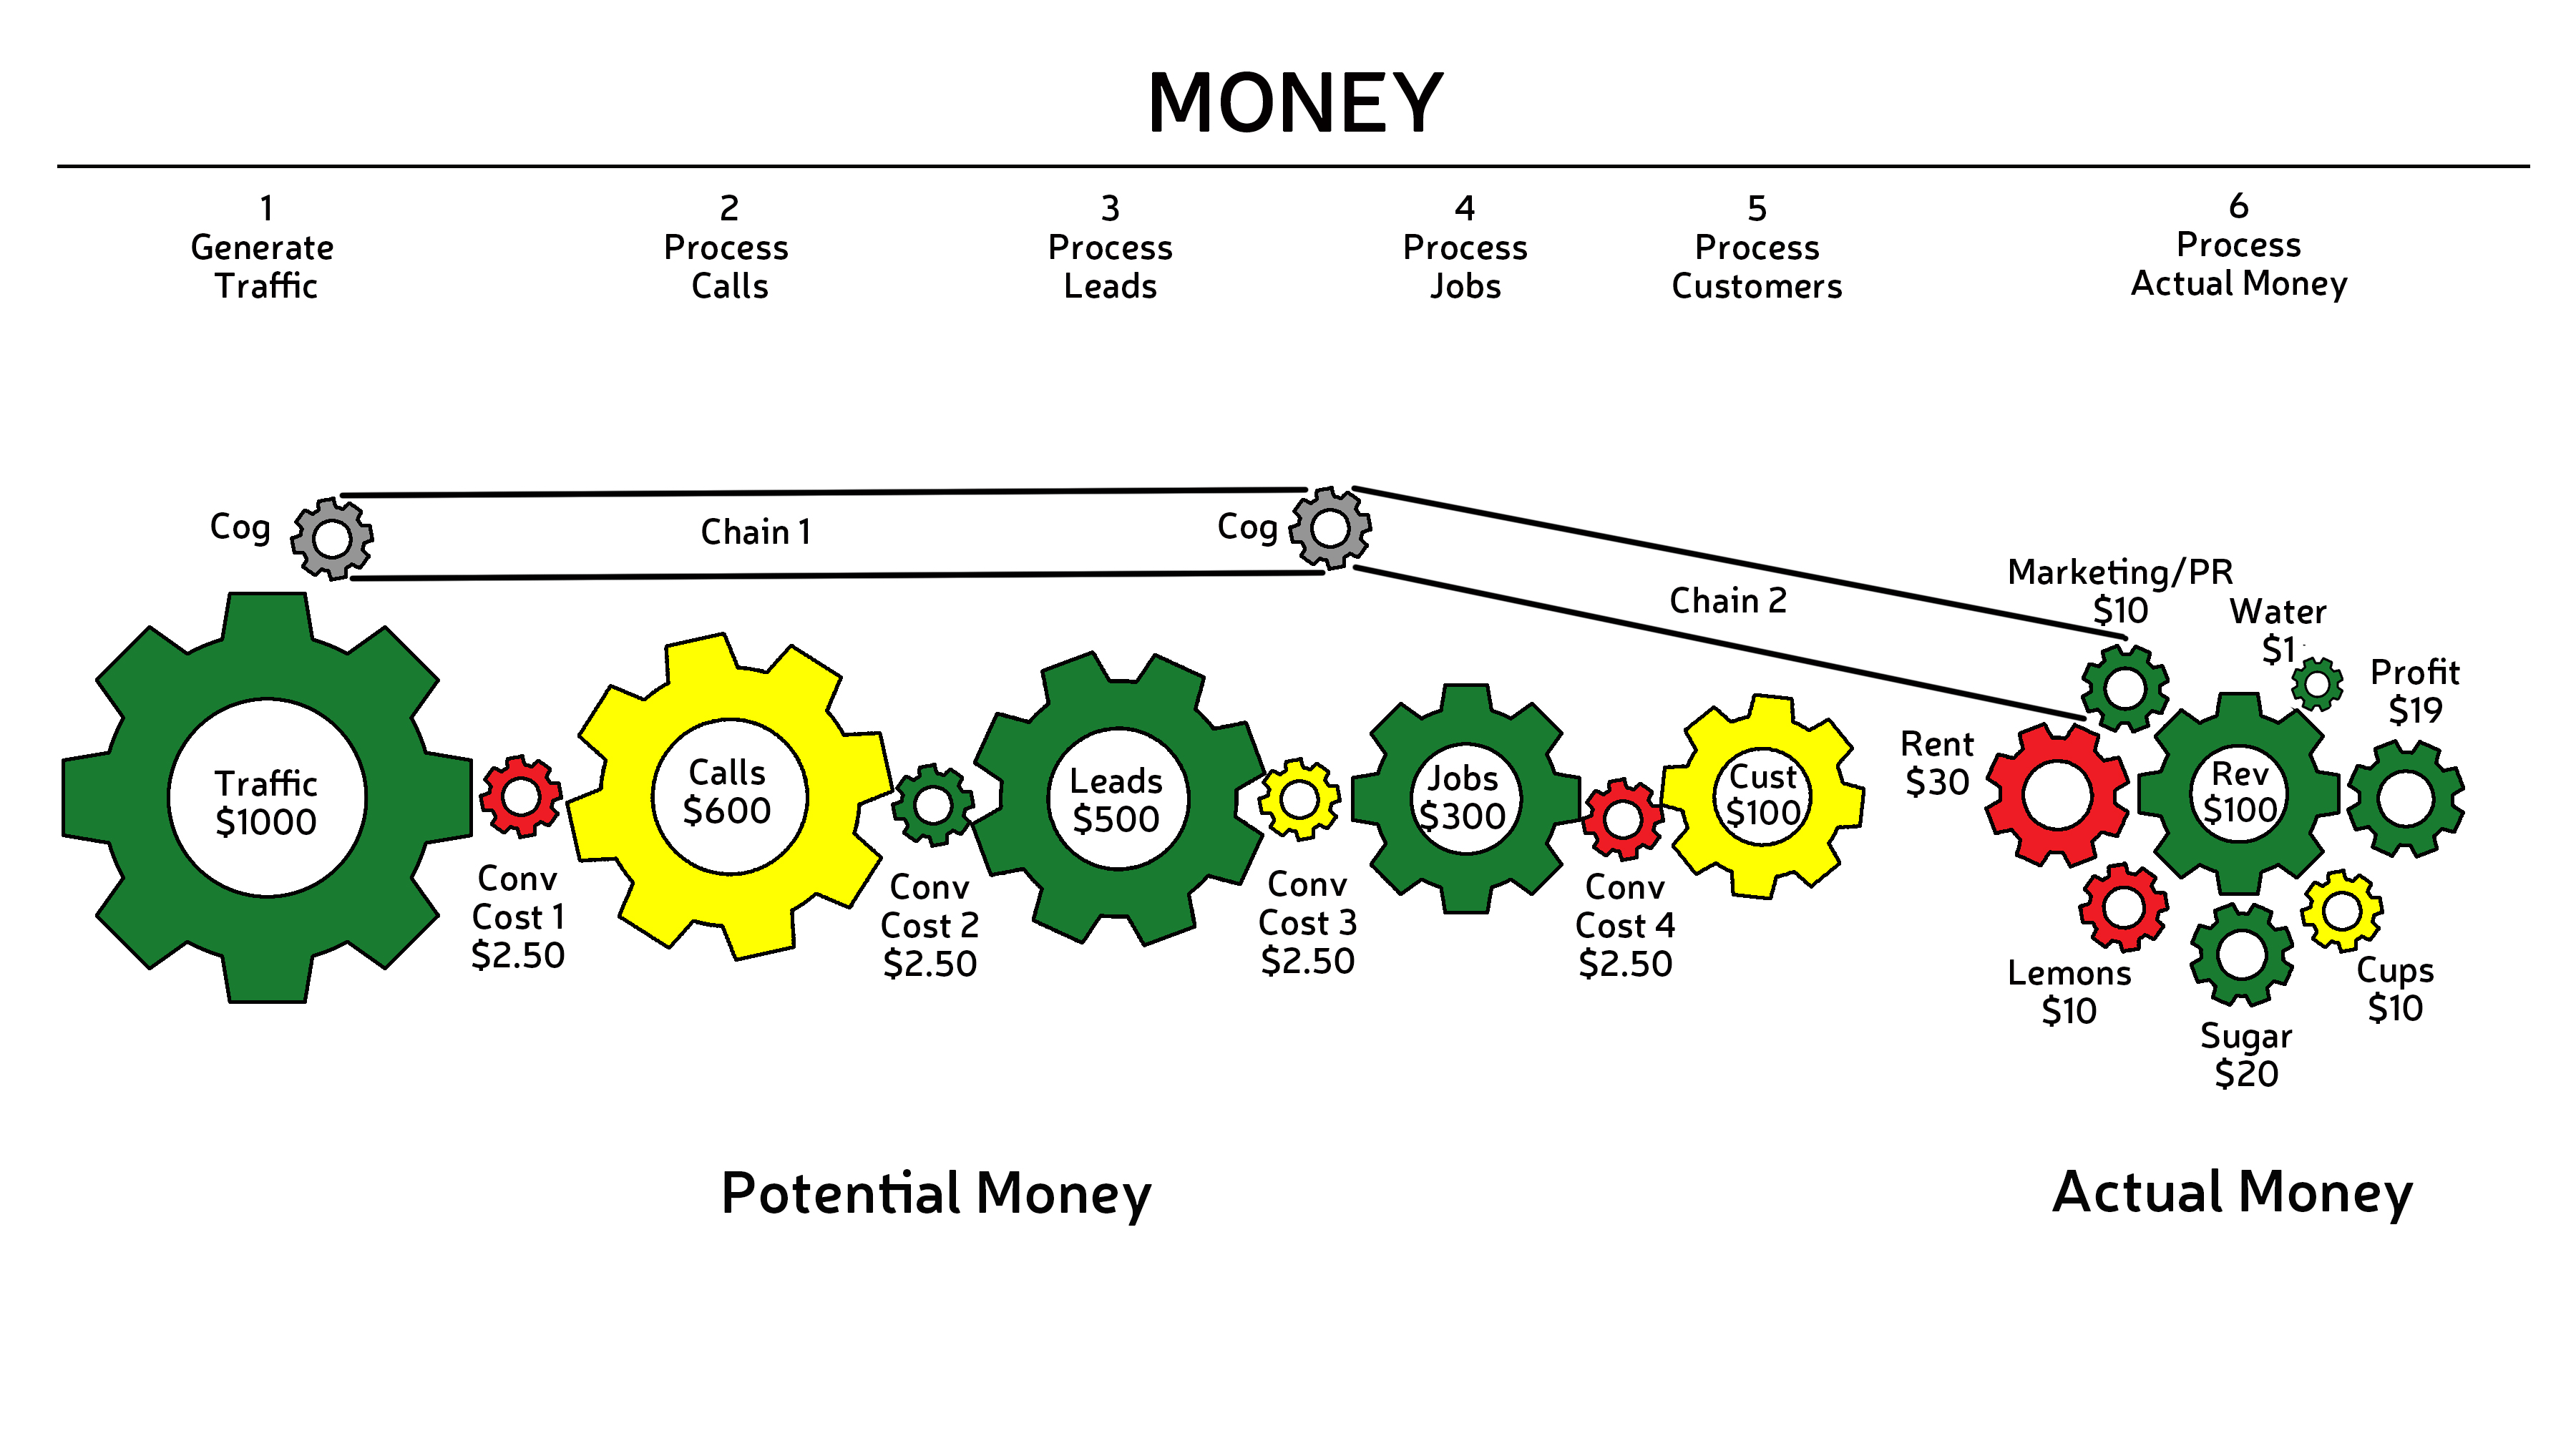 Prevailing wisdom holds that PR and Marketing efforts increase traffic to your business. More money spent on PR and Marketing equals more traffic.
To visualize this relationship in our model, connect the PR and Marketing gear to the Traffic gear with a chain. If the theory were correct, we would expect that the traffic gear in our model would spin faster as the PR and Marketing gear got bigger. However, PR and Marketing efforts don’t work immediately and it takes time for the increase in traffic to have an impact on the engine as a whole. And the jury’s still out on just how effective PR and Marketing are in influencing potential customers. So, keep an eye on it over time and see what happens.
STEP 7: GIVE YOURSELF A PAT ON THE BACK
Congratulations! You have made it through the first visualization process, and you now have a dynamic, scale model of your business engine. Whether things are humming strong or sputtering along with knocks and pings, the good news is you have built a diagnostic model. You are an expert visionary of your business. And because you can now see it better, you can now make it better than it’s ever been. In the Optimization unit, I’ll give you tips for how to do just that. But for now, let’s visualize the last two elements of our energy and information system: Metrics and People.
- A money model starts with a timeline representing the processes involved in the circulation of through a business. A dollar sign moving across the timeline represents the time cycle accounted for by the model.
- Potential money, actual money, and conversion costs are represented by gears, which are scaled in relation to the size of the revenue gear.
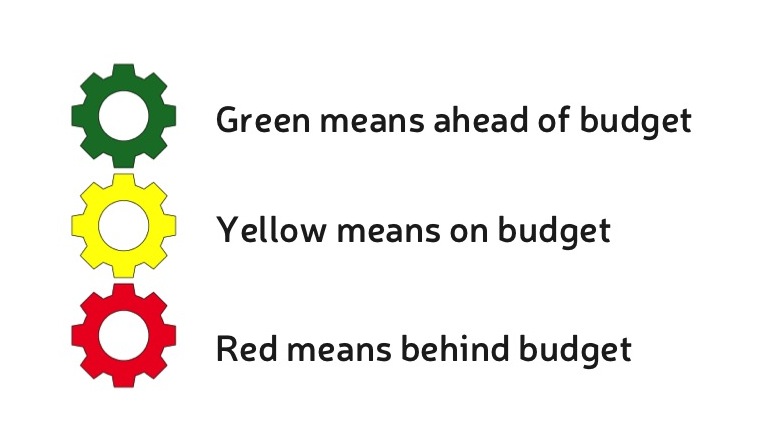
- Theoretical money is represented by color-coding gears (green=under budget, yellow=on budget, red=over budget).
- The rotation of gears indicates whether money is entering or leaving the system.
- The speed of gears indicates how fast money is being made or lost.
In the next section you will learn about the role of metrics in modeling a business system.