VISUALIZING ENERGY AND INFORMATION SYSTEMS
My mind has been building energy and information systems into models since I was a kid. Every system I’ve ever imagined has exhibited the same pattern.
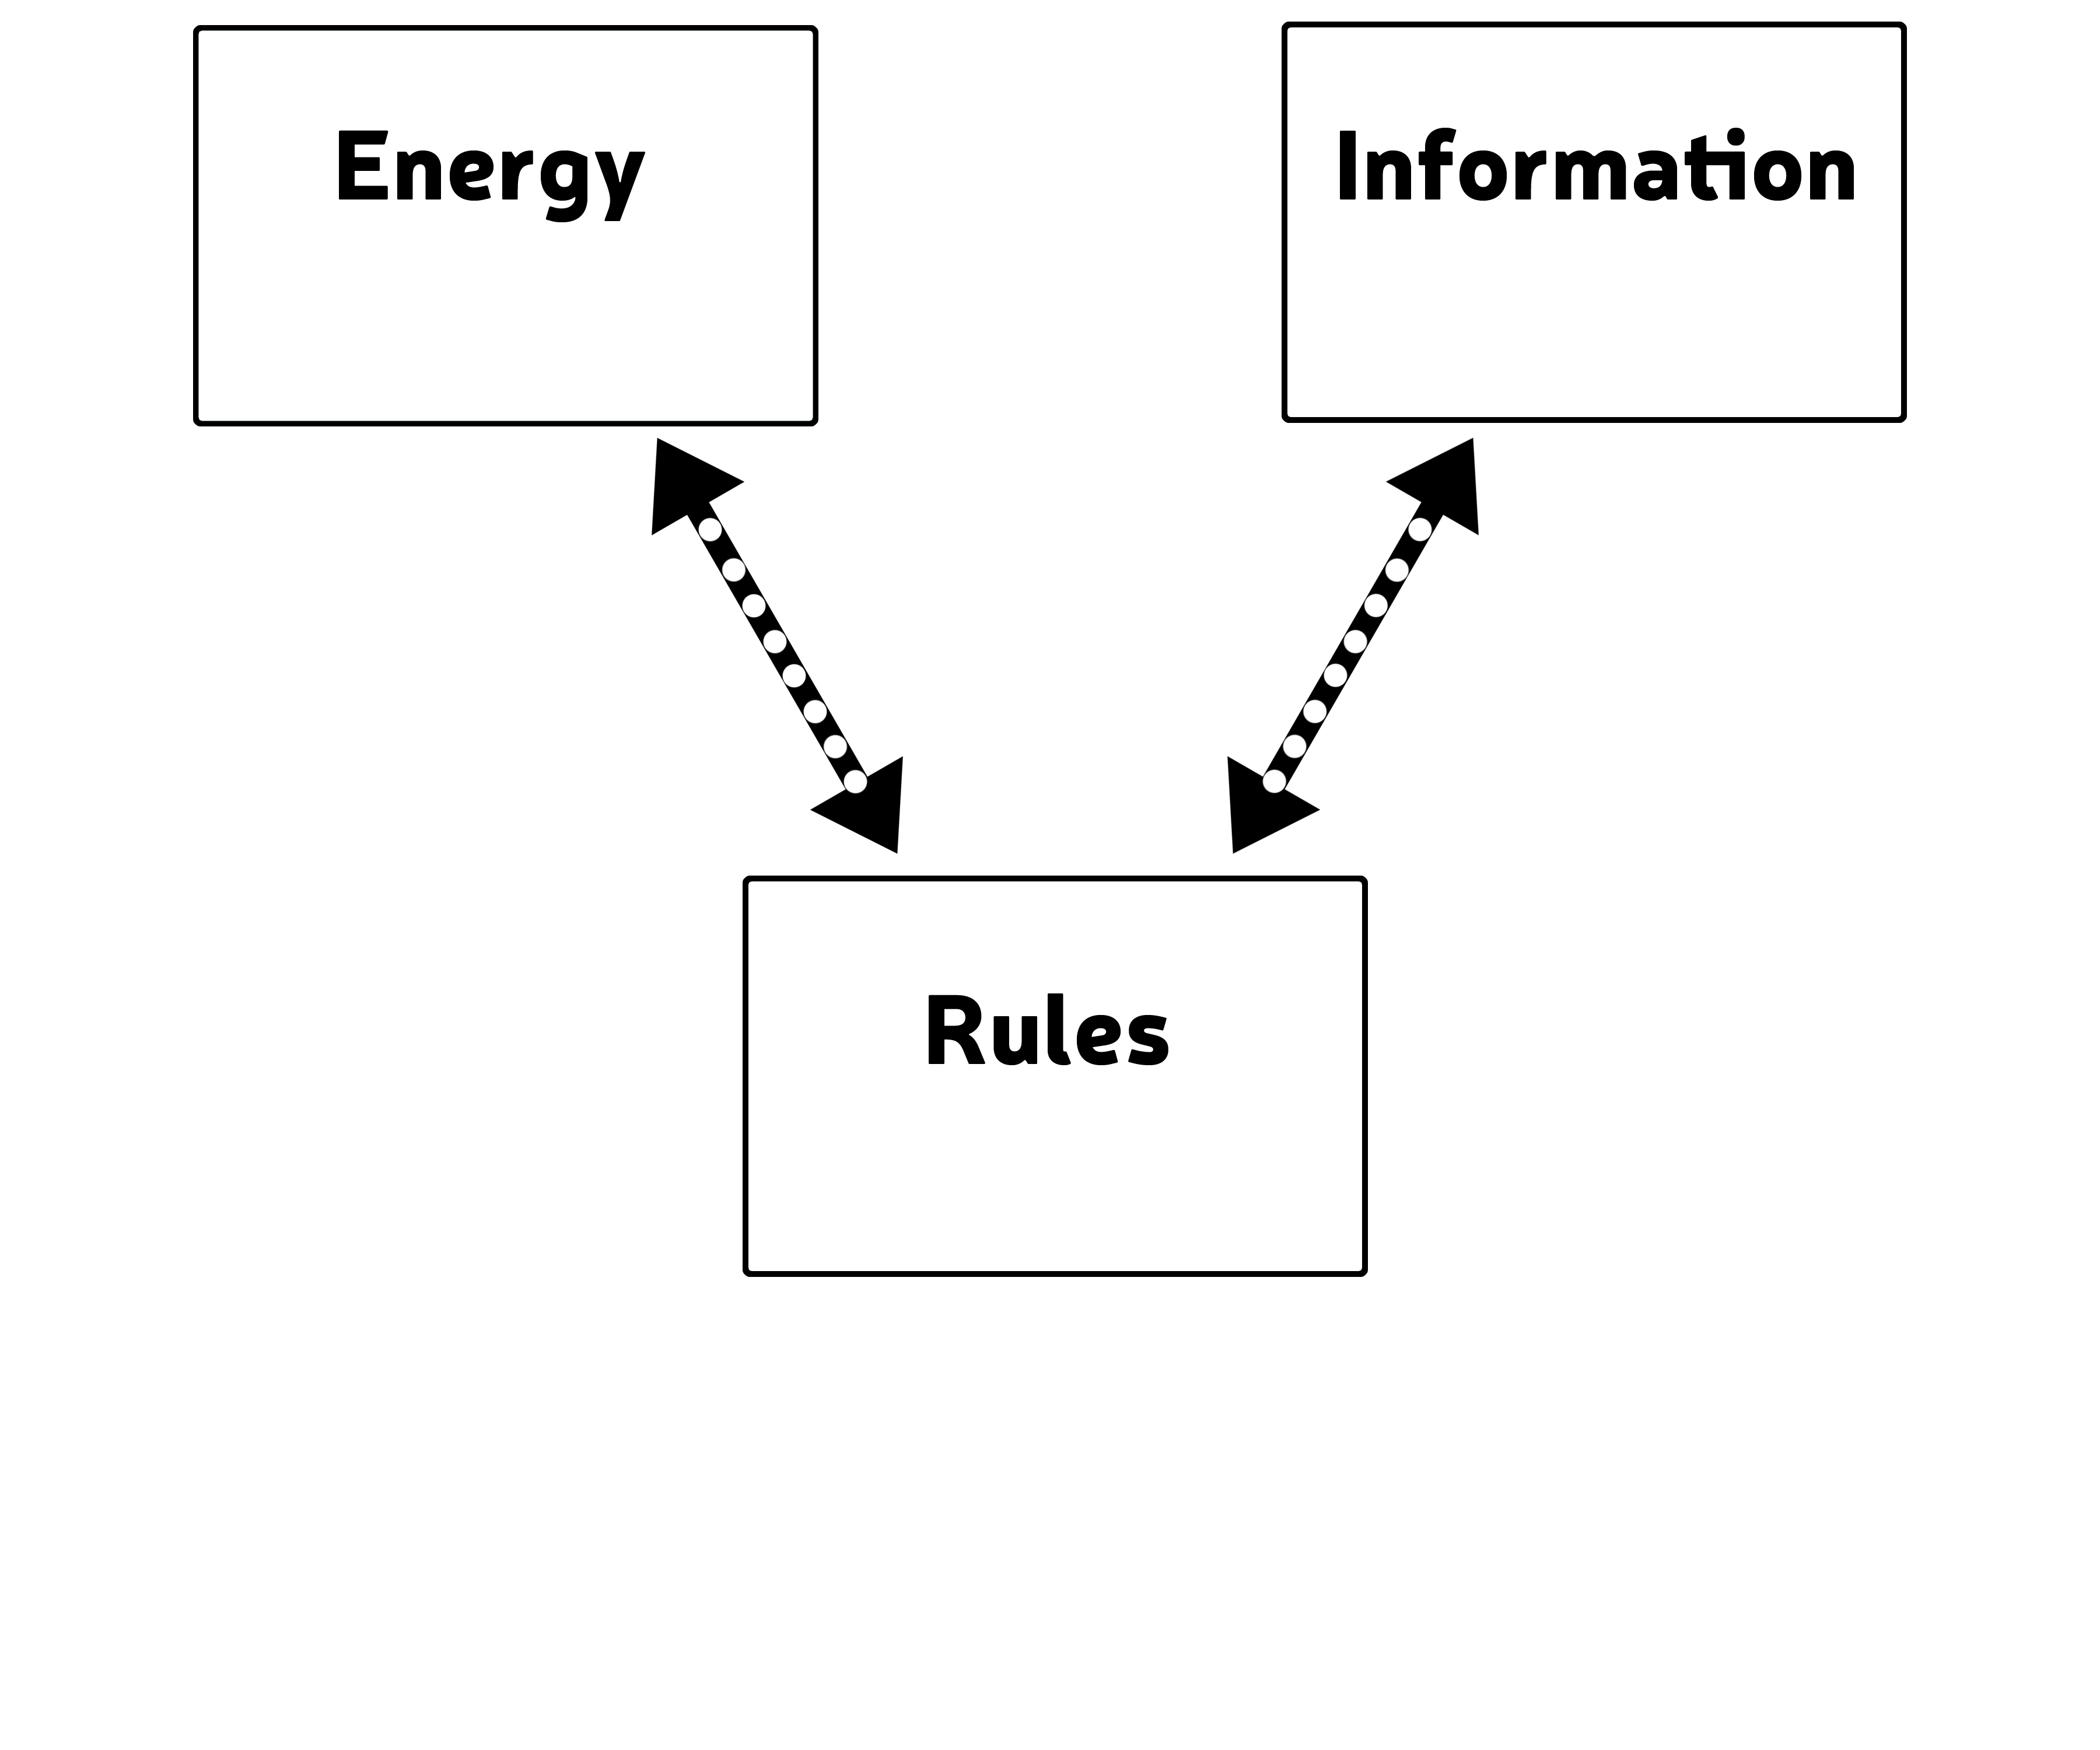
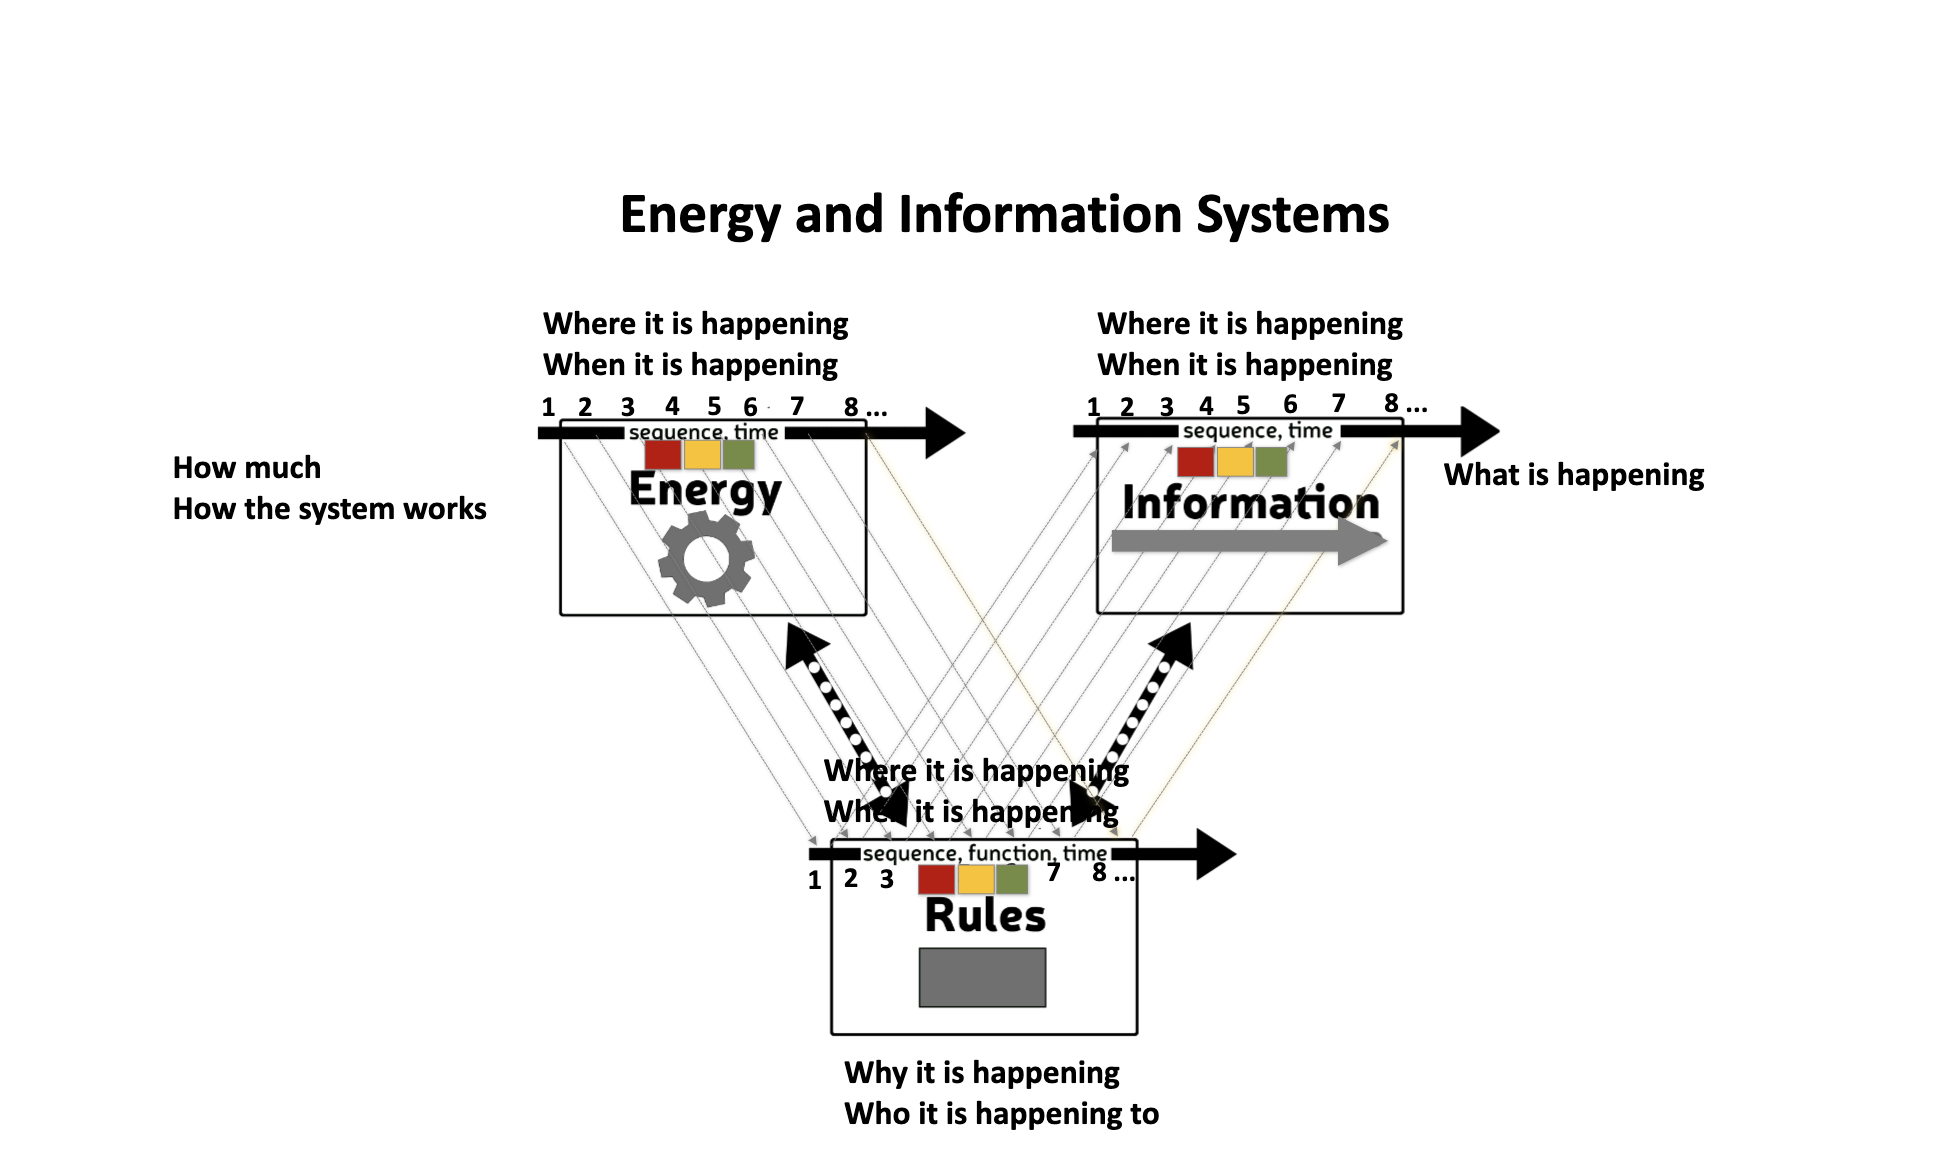
The energy structure is on the left, the information structure is on the right, and there’s a set of rules connecting them.
In the case of Einstein’s formula, we can map the system like this:
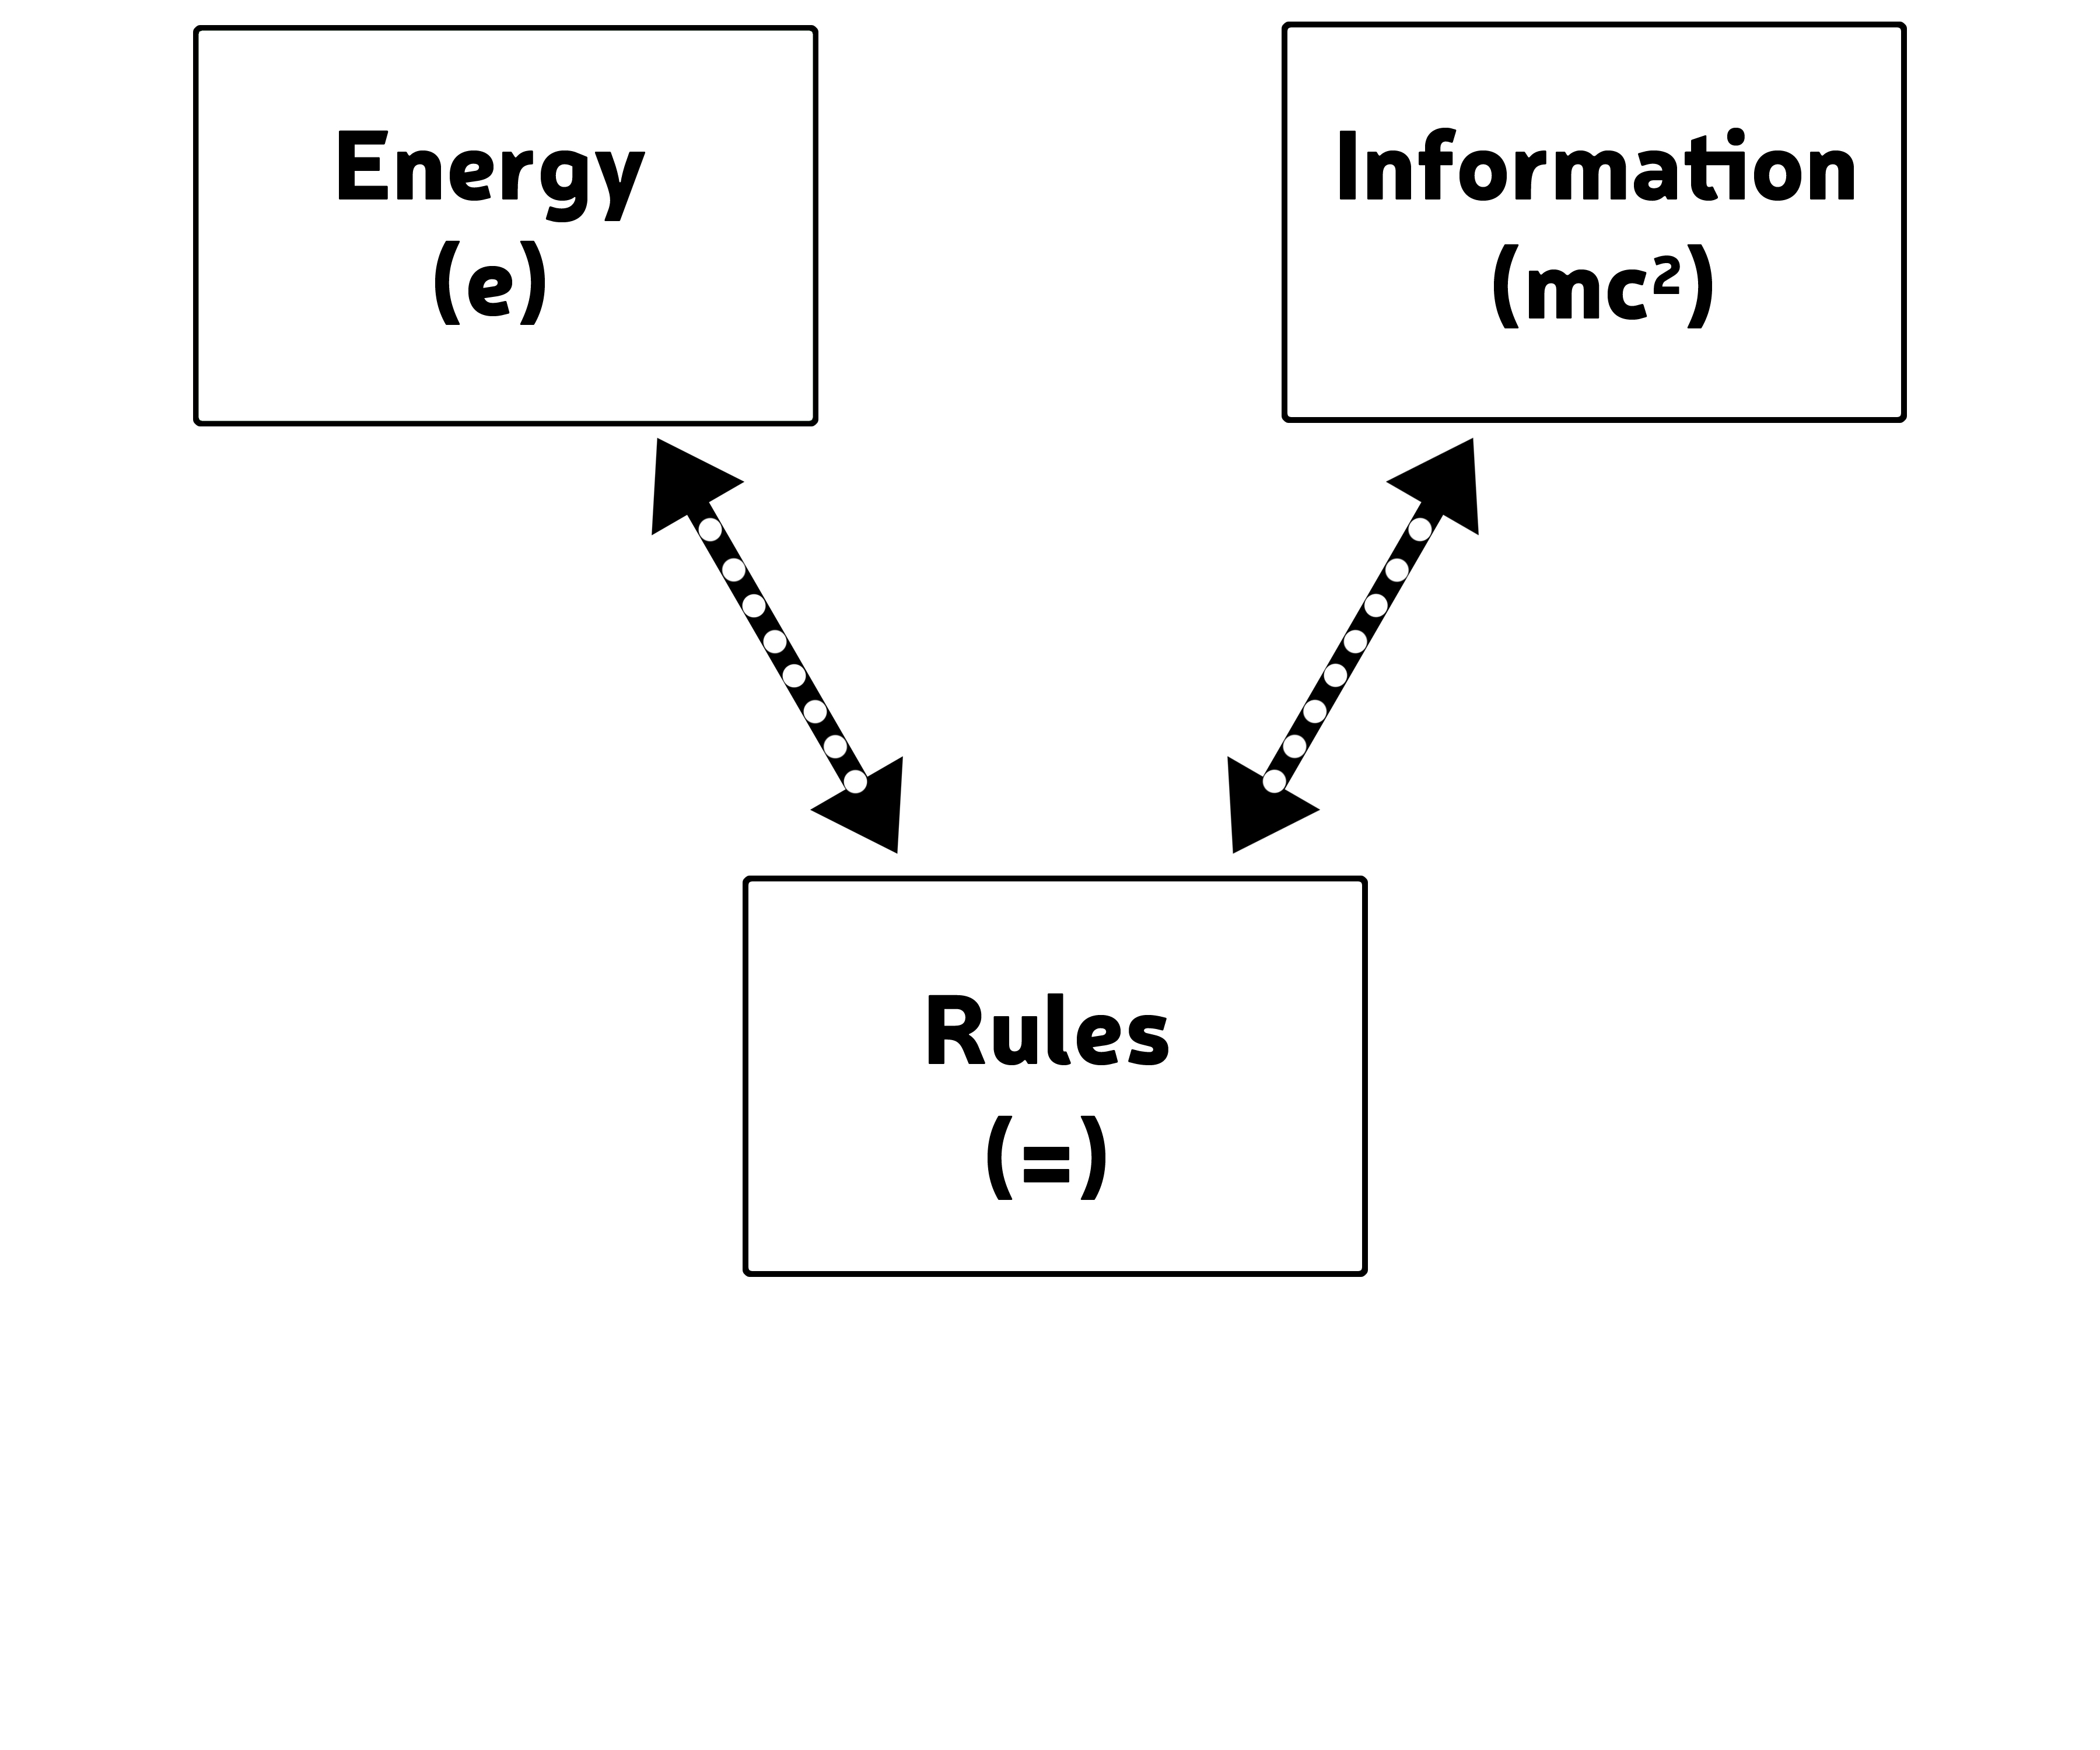
The little “e” is energy, “mc^2” is the information, and the rule that connected them is “=”. Energy is equal to mass times the speed of light squared.
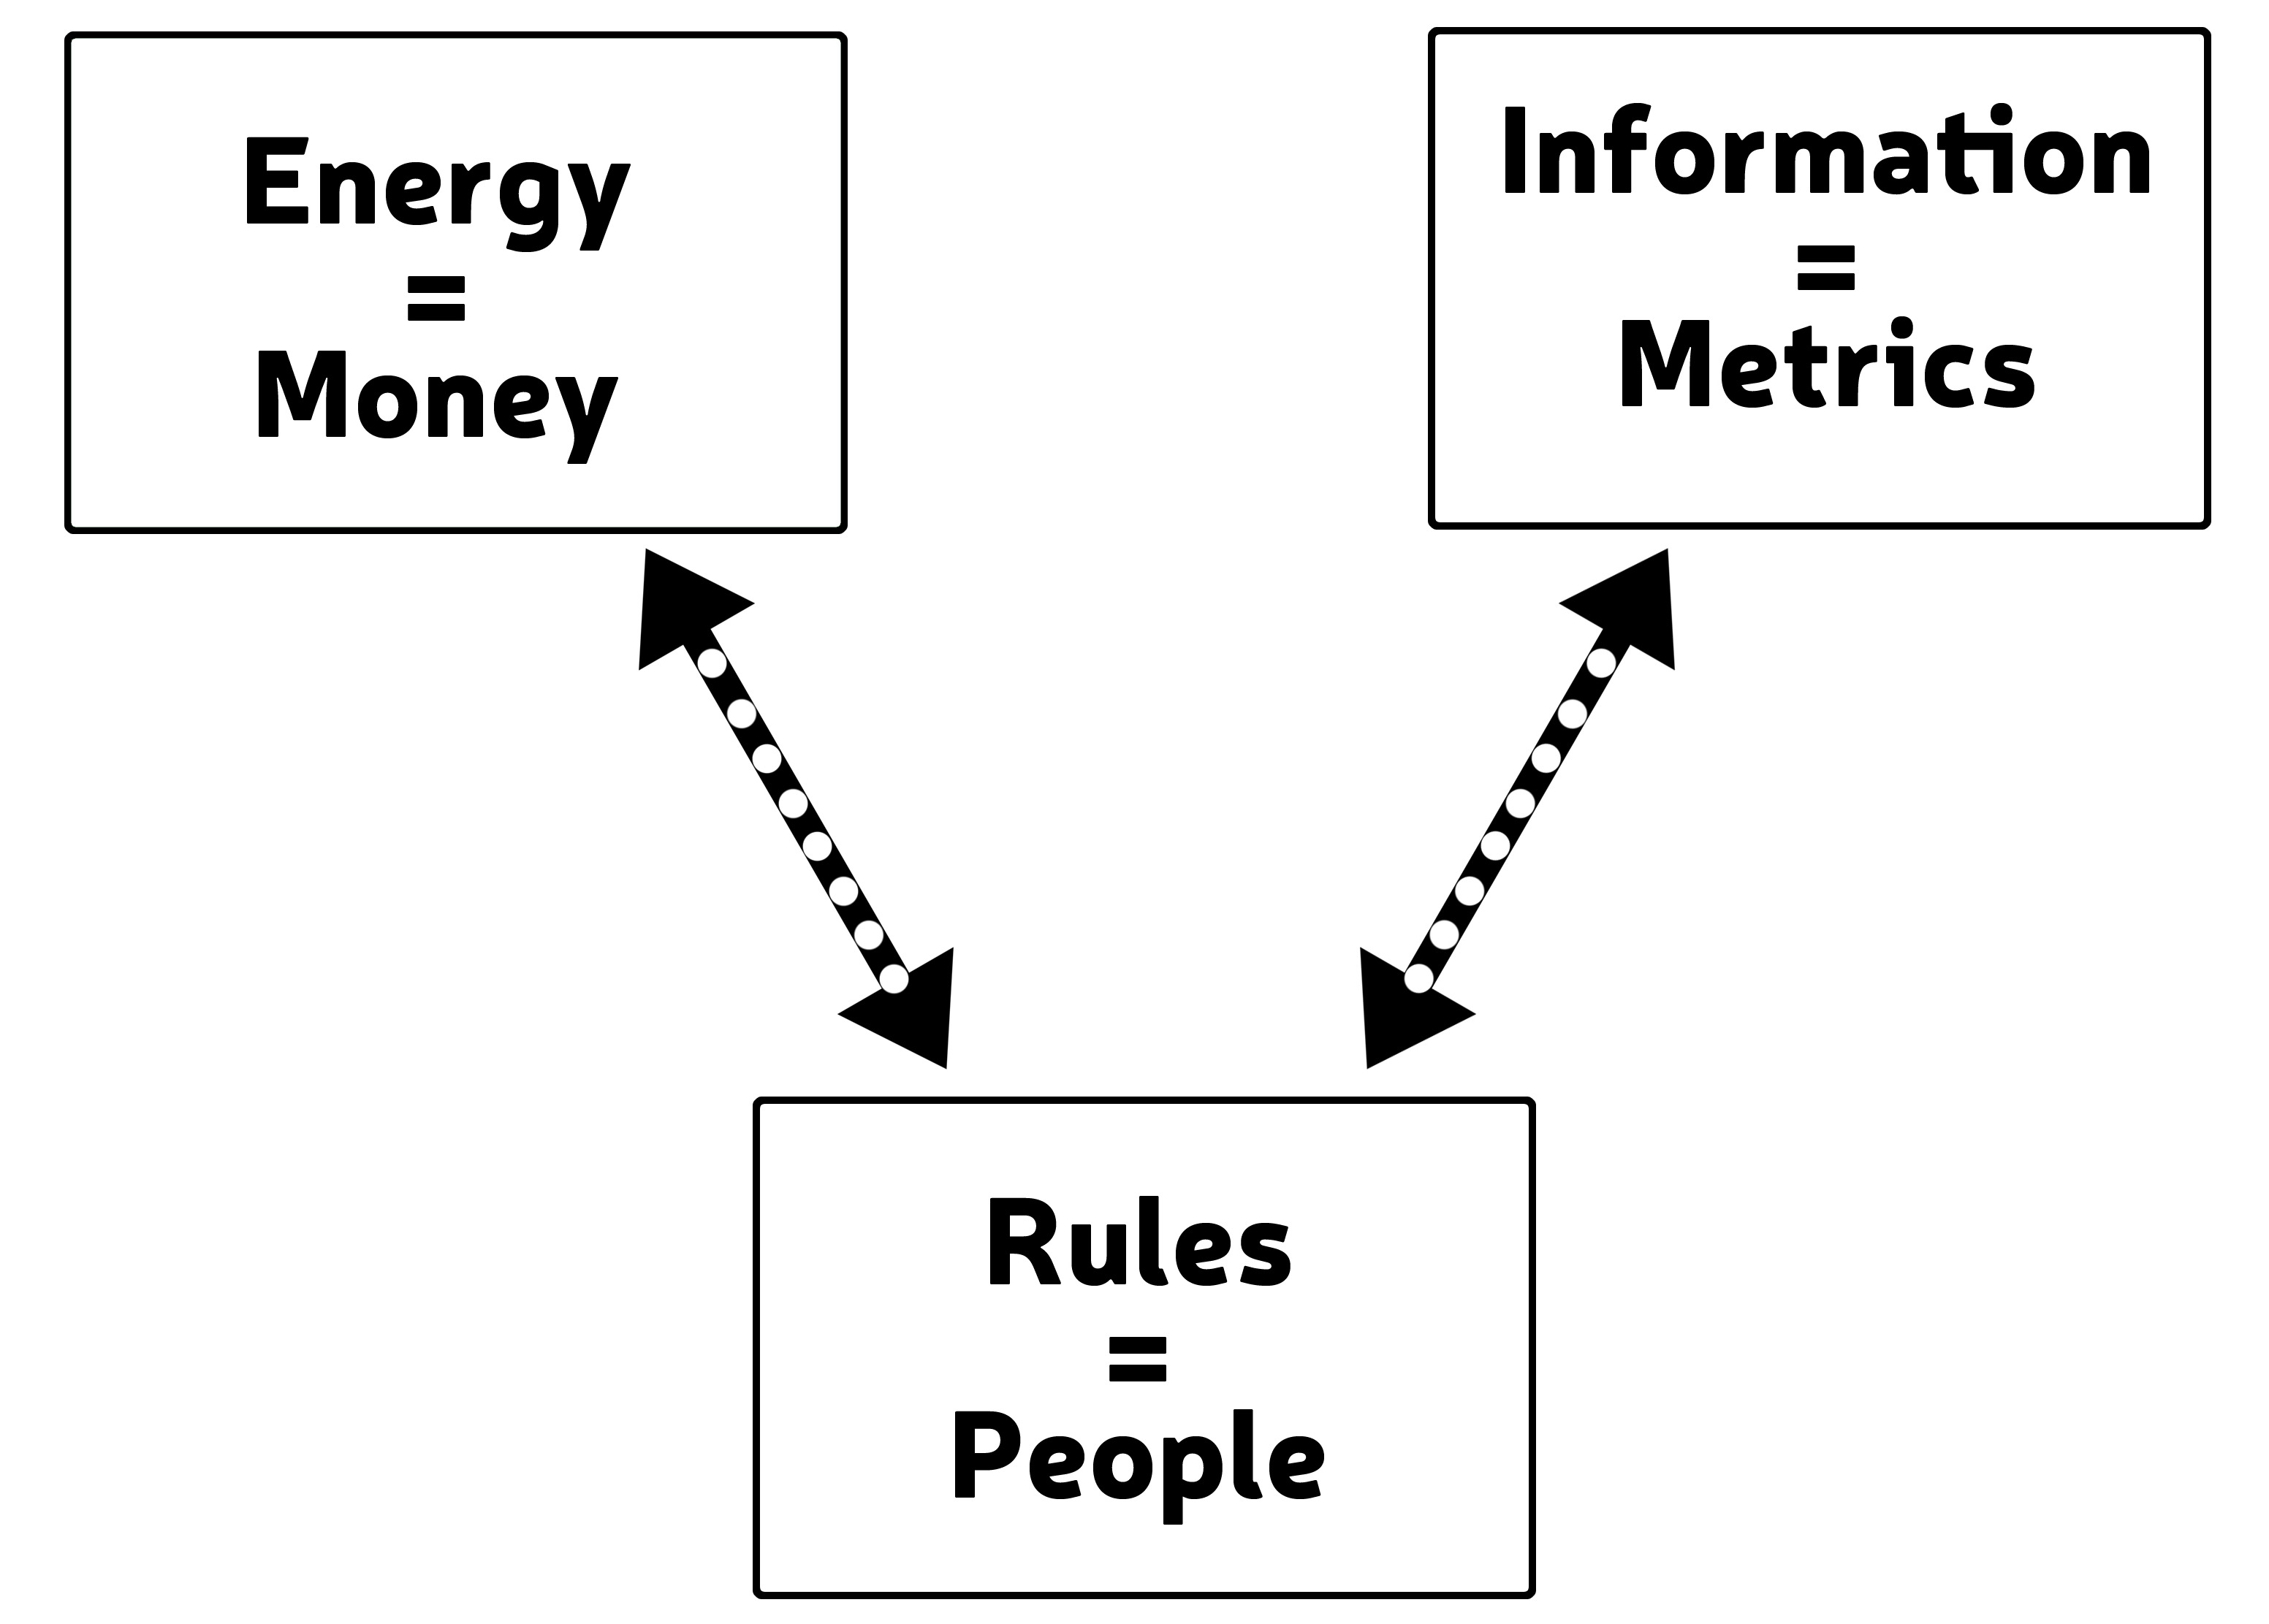
The same pattern holds for the production process. But here we need to make some substitutions to define the system in terms relevant to business.
 In the production process:
- Energy is related to how much money is being processed.
- Rules are related to the behavior of the people doing the work.
- Information is related to metrics, or key performance indicators.
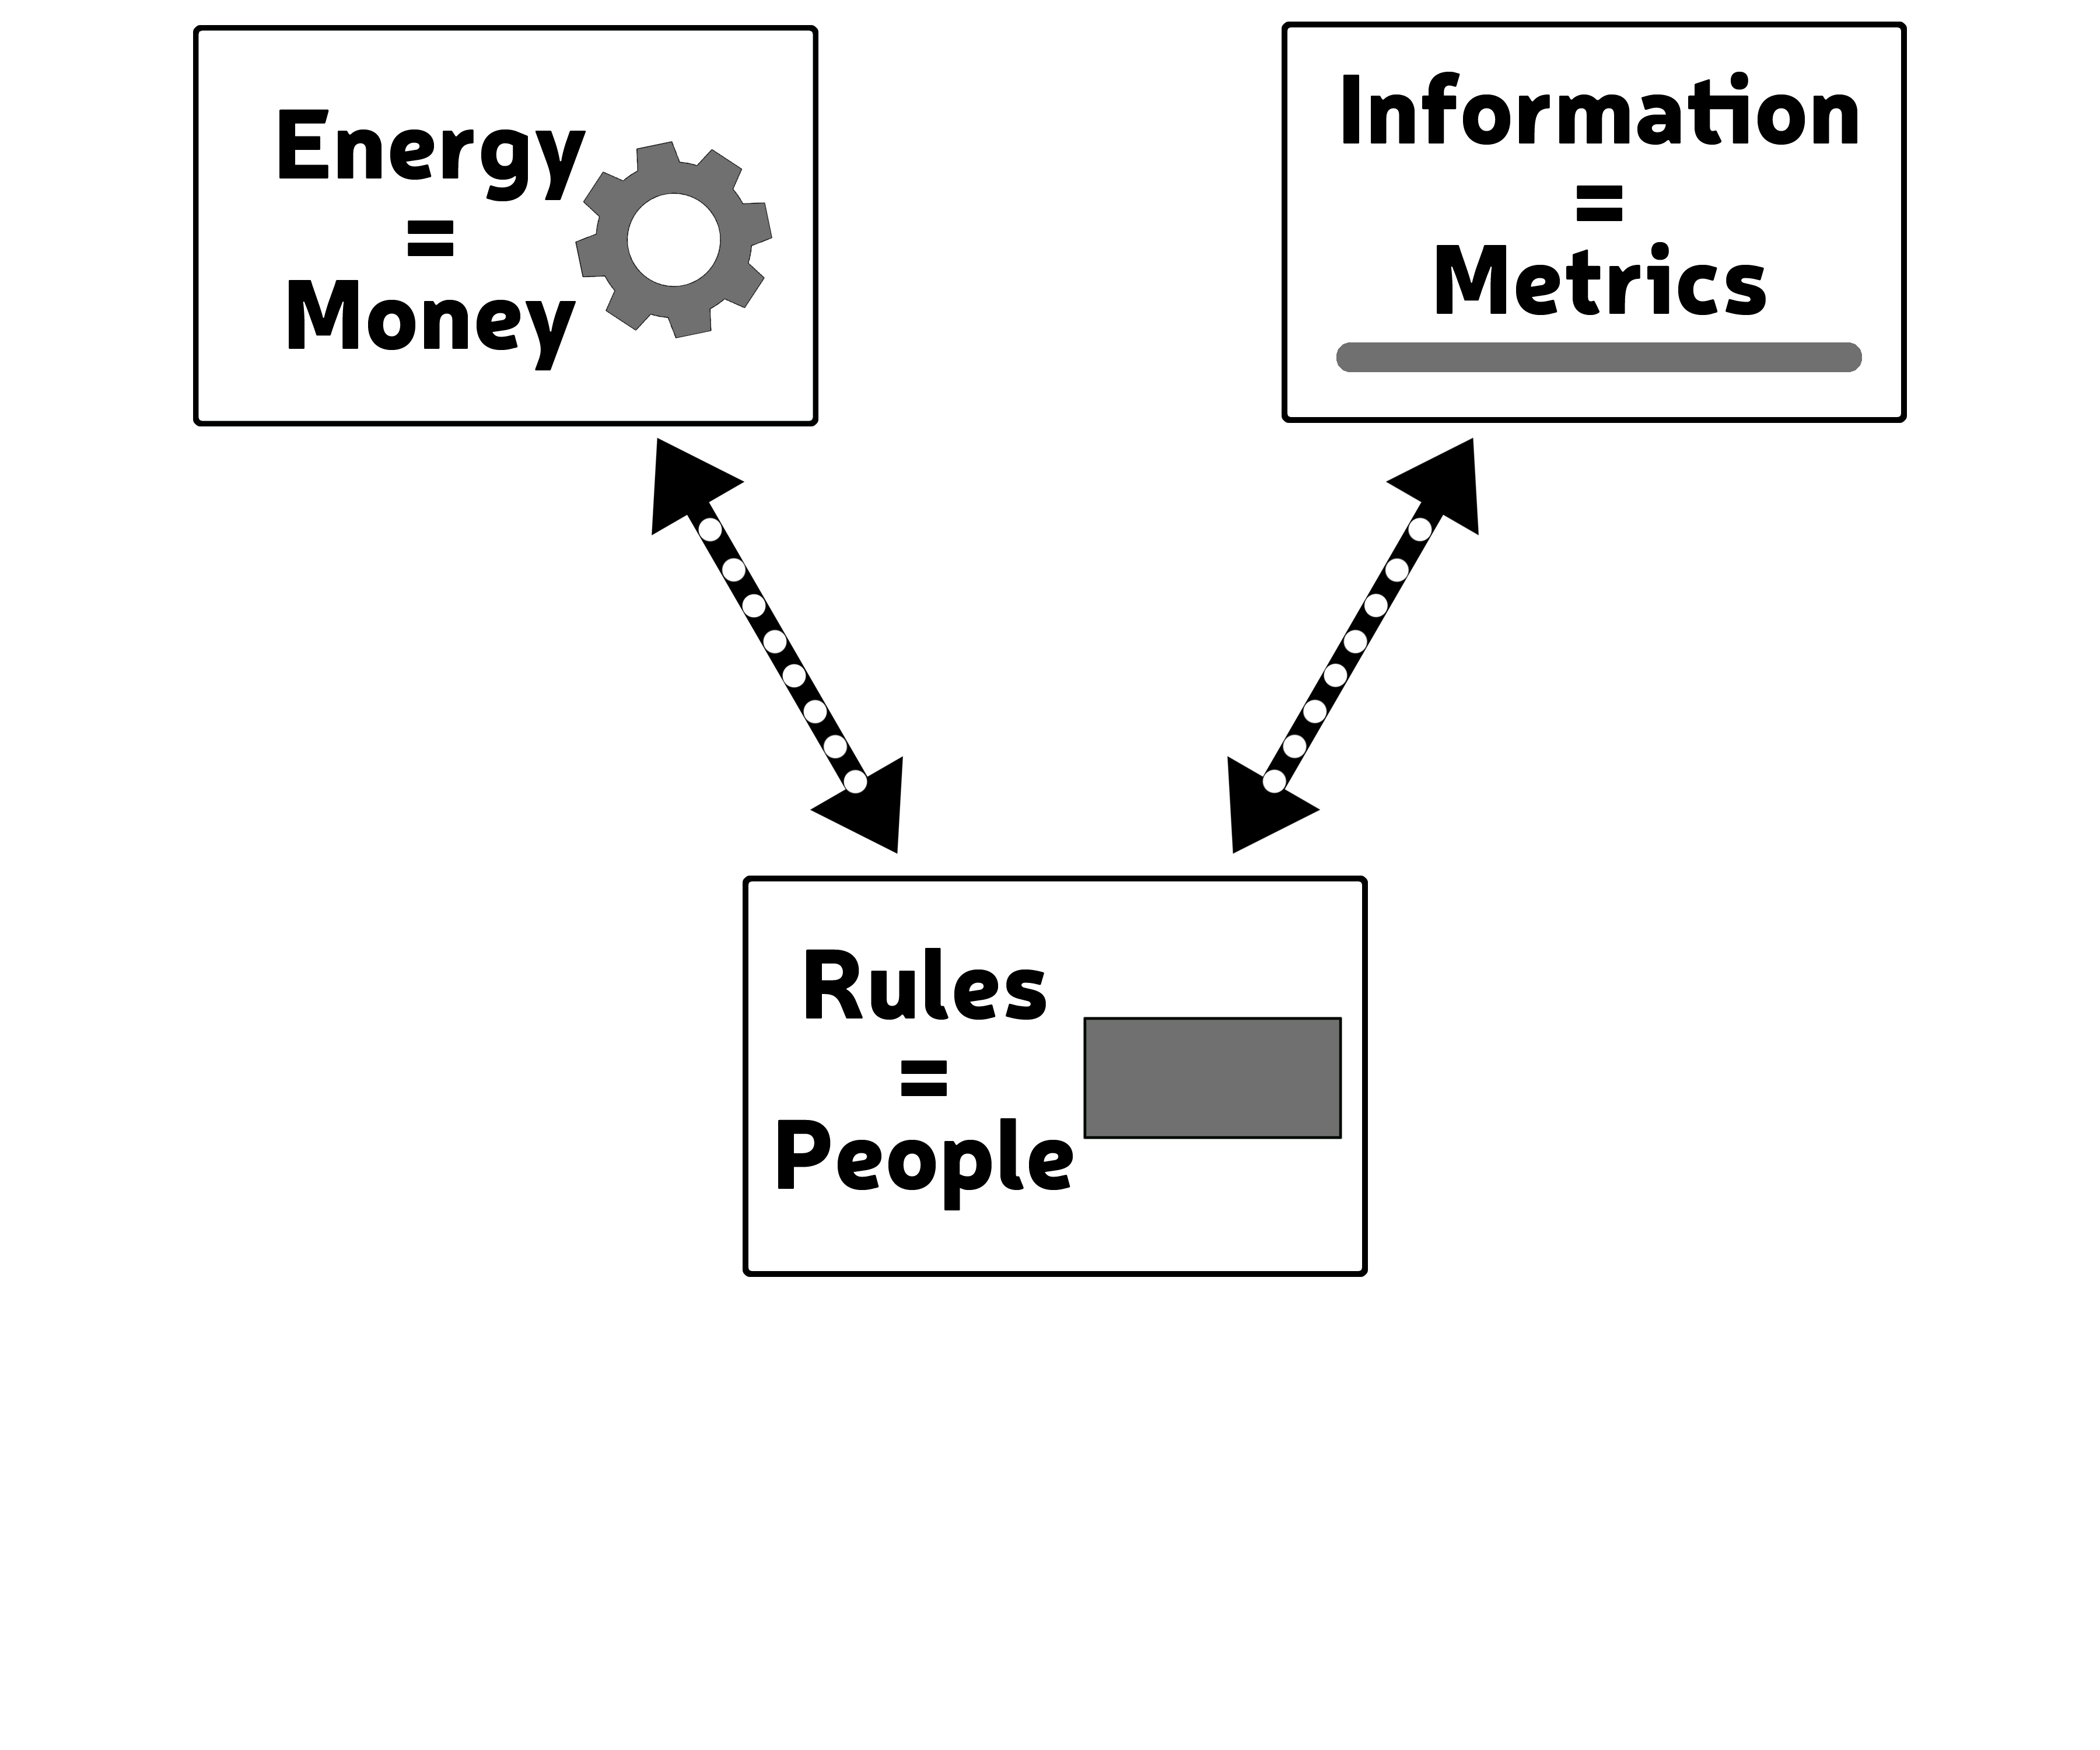
Since our overall goal here is to create a visual model of our business, let’s go a step further and replace our words with symbols.
Gears will represent money. Lines will represent metrics. And rectangles will represent people. Like this:
As in all systems—where energy depends on rules and rules depend on information—the relationships between money, performance, and friction will determine the outcome of the production process. But that outcome can be impacted by several other variables.
In an energy and information system, energy, rules, and information are subject to functions (the factors and processes that make something happen), sequence (the order in which functions are carried out), and time (how something happens over the course of a given period). Imagine it like this:
You light a match. It takes energy (calories) to strike the match. The match tip is made of chemicals that follow specific rules (thermodynamics). There is information (the friction strip on the matchbook). It is the combination of the energy, the rules, and the information that determines if the match will light. These things are dependent on each other. They are also related by:
Function (e.g., metabolic calorie conversion from food to energy)
Sequence (e.g., the flame doesn’t light BEFORE you strike the match)
Time (e.g., At 0 seconds there is no spark. At .1 seconds the match heats up. At .2 seconds the match gets hotter. At .3 seconds it achieves an activation energy that initiates a thermodynamic process that lights the match. At .4 seconds the match starts to burn).
Taken together, these pieces—Energy, Rules, Information, Function, Sequence, and Time—add up to a complete picture that tells us:
- How the system works (Energy)
- How much of something is being processed or created (Energy)
- What is happening (Information)
- Who it is happening to (Information)
- Why it is happening (Rules)
- Where it is happening (Energy, Information, Rules)
- When it is happening (Energy, Information, Rules)
Since this is true of all energy and information systems, our next step is to factor in the elements of function, sequence, and time to our model of the production process.

In the chapters ahead, we’ll zero in on each element of this energy and information system, and I’ll show you what it means in terms of actual production and practical application.
When we put the pieces back together, you’ll be able to behold your business in a brand new light.
- All energy and information systems follow the same pattern.
- You can visualize energy and information systems by putting energy to the left, information to the right and connecting them both to rules.
- In your Production Process, money is the energy, metrics are the information, and people and their behaviors are the rules.
- In Business Visualization, money is represented by gears, metrics are represented by lines, people are represented by rectangles.
In the next section you will learn about the three different types of money in your business.