PUT YOUR MONEY WHERE YOUR EYES ARE
To demonstrate how money works in a business and to show you how it can be visualized, I’m going to give you the simplest example I can think of: A Lemonade Stand.
Let’s say that Lisa owns a lemonade stand.
ACTUAL MONEY
Lisa plans to make money by charging $1 per cup of lemonade. But she also knows that she will have to pay out money for rent, supplies, and marketing/PR.
Lisa calculates that for every $100 she makes in revenue, she will spend:
- $1 on Water
- $10 on Marketing/PR
- $10 on Lemons
- $20 on Sugar
- $10 on Cups
- $30 on Rent
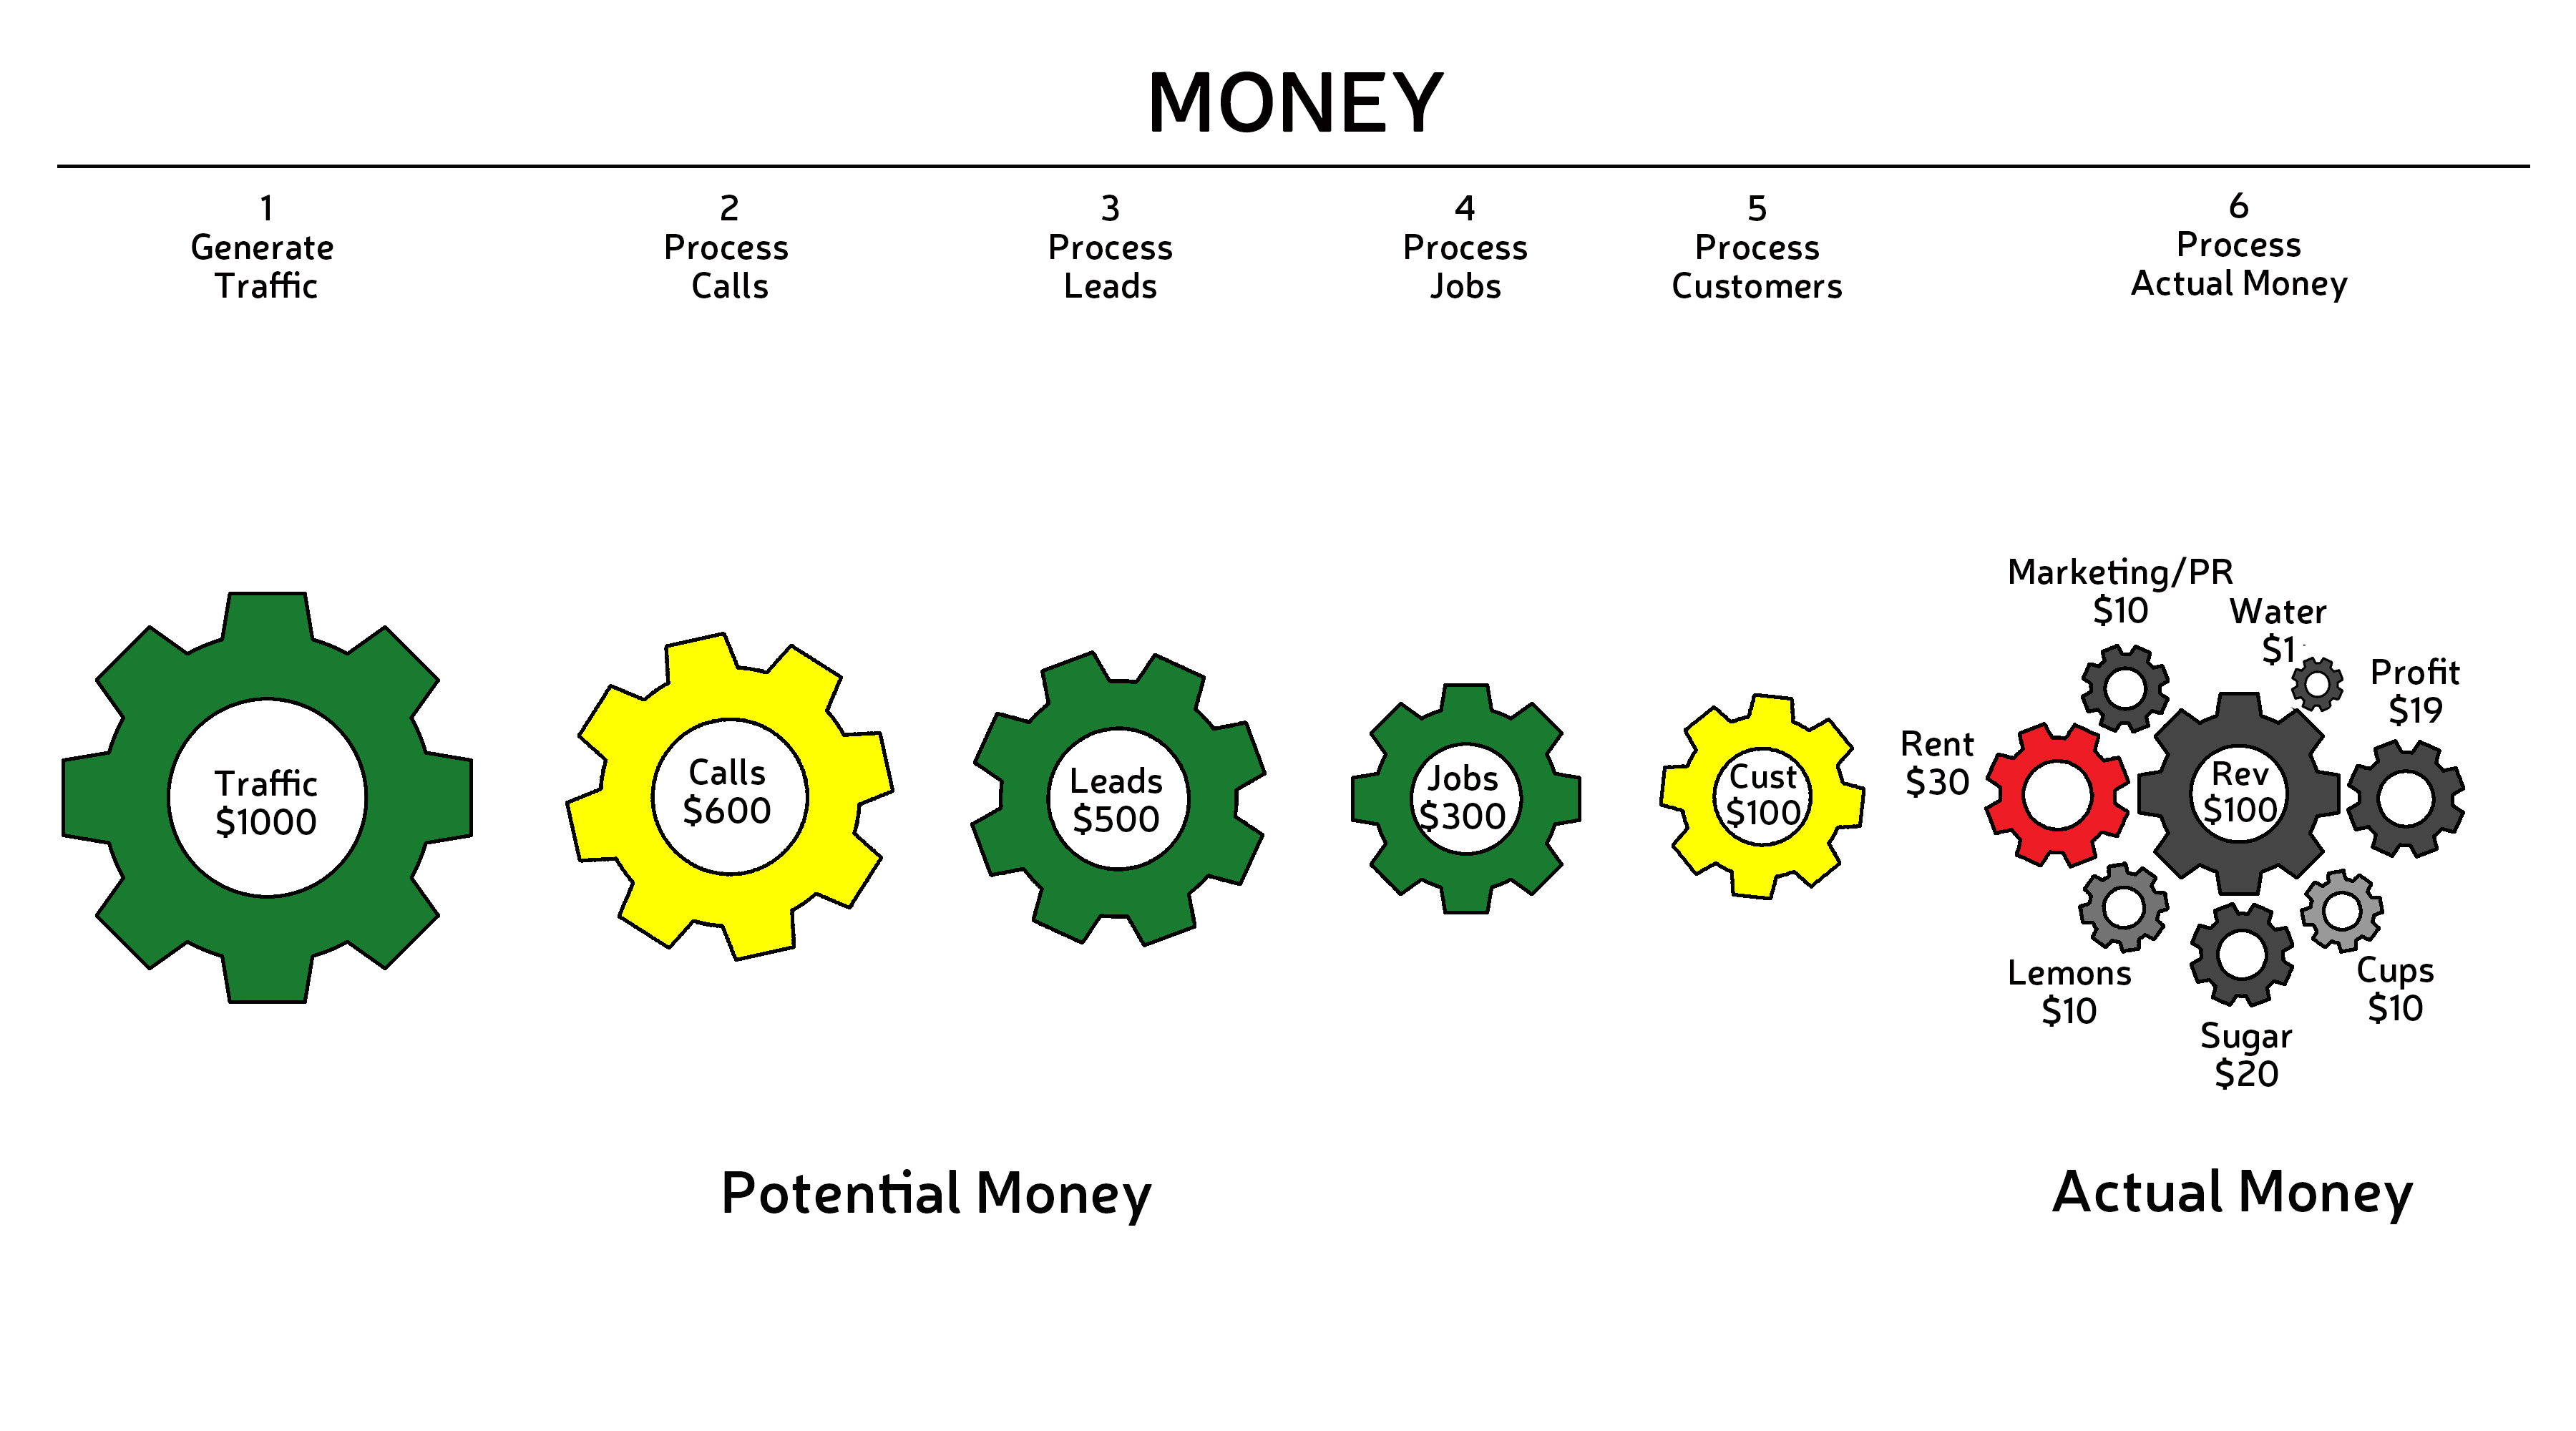
Visually, we can represent Lisa’s revenue and costs like this (Remember we’re using gears to represent money):
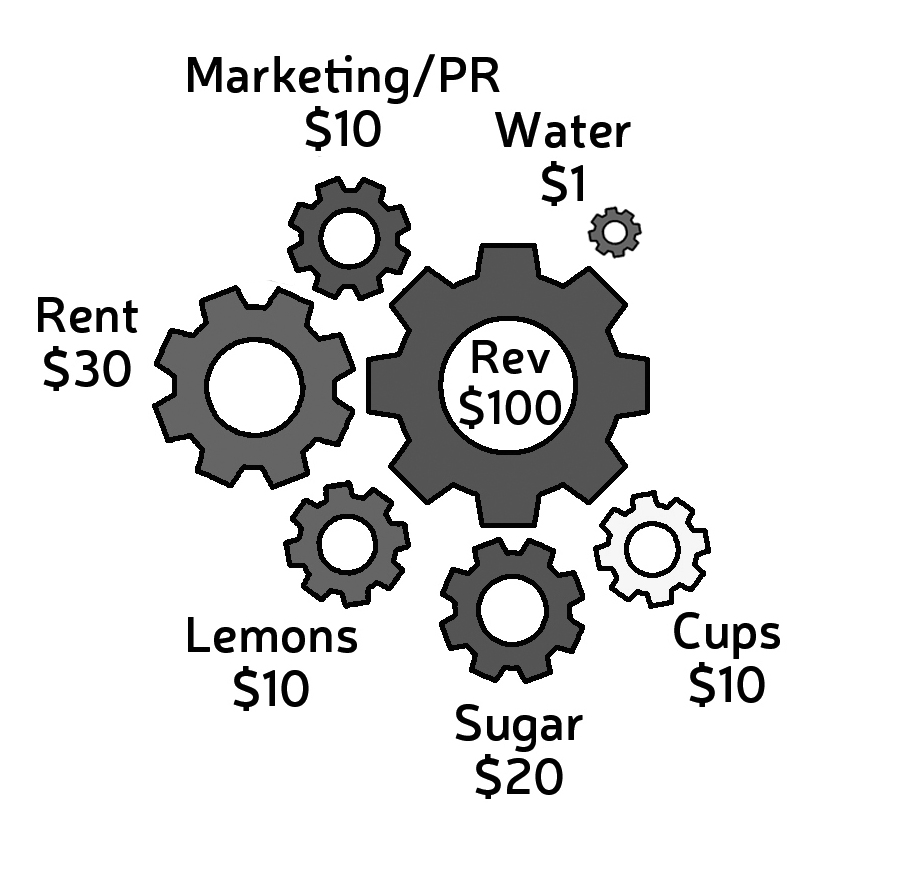 In this image the size of the cost gears are determined by their ratio to the total revenue (100%). Lisa has two kinds of costs–variable costs, like water, lemons, and cups, that will go up and down with the revenue and fixed costs, namely her rent, which stays the same regardless of how much lemonade she sells. The gears representing variable costs will change in size as revenue scales, but their percentages will stay the same. The gears representing fixed cost will not change in size as revenue scales.
As a result of her fixed and variable costs, Lisa budgets that she will earn more than 19% in profit after all expenses and salary are considered. So, let’s add another circle to represent profit. This circle is also scaled relative to total revenue and will change size as revenue does.
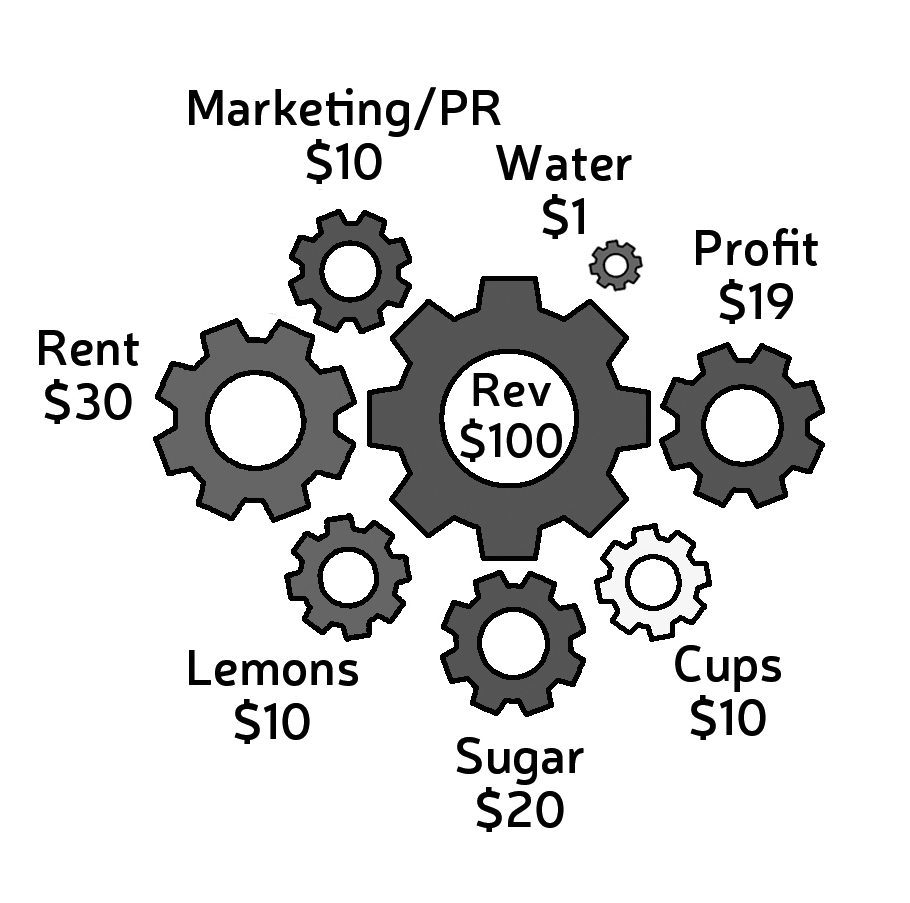 We now have a picture of the Lemonade Stand’s ACTUAL Money. Let’s look at her POTENTIAL MONEY next.
POTENTIAL MONEY
Since, as I mentioned above, POTENTIAL money is seen in the sales funnel, let’s start there and create an image of a generic sales funnel:
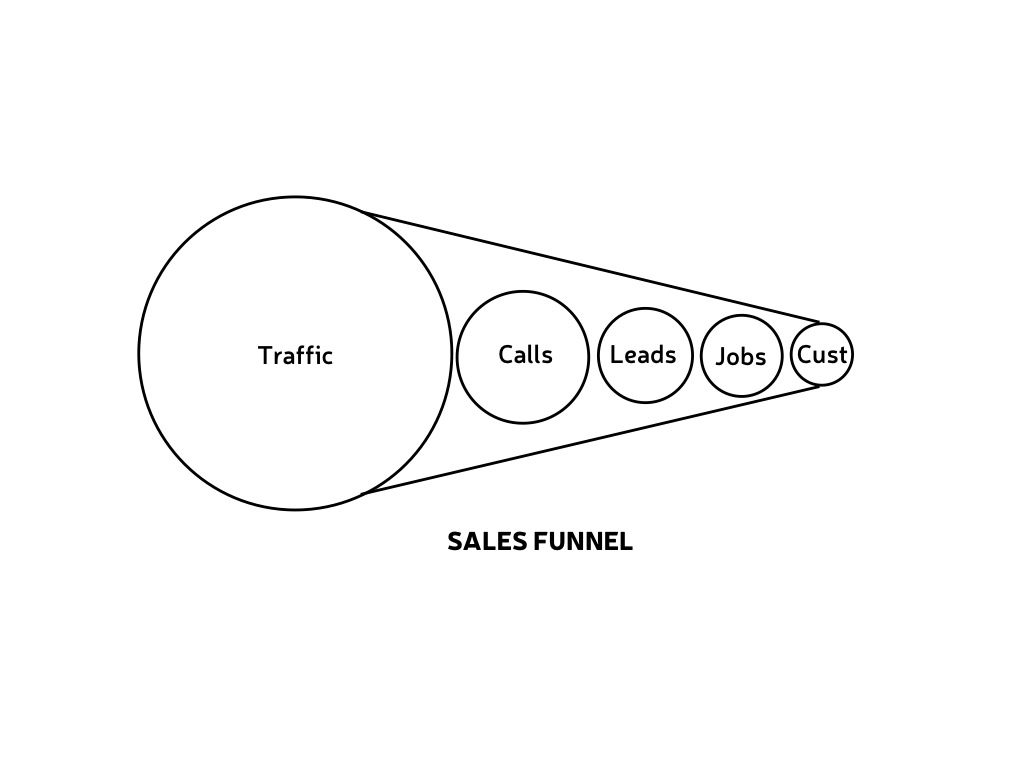
- Traffic: The number of people who are impacted by your brand in every way. This includes web hits, those who hear your ads on the radio, people who see your trucks, your TV ads, etc.
- Calls: The number of people who contact the company via phone, web, email, etc. to inquire about the product or service.
- Leads: The number of people who are qualified to buy the product or service.
- Jobs: The number of people who schedule or order the product or service.
- Customers: The number of people who actually pay for the product or service.
As the name “funnel” suggests—and as the diagram shows—the pool of people typically narrows at each stage in the process.
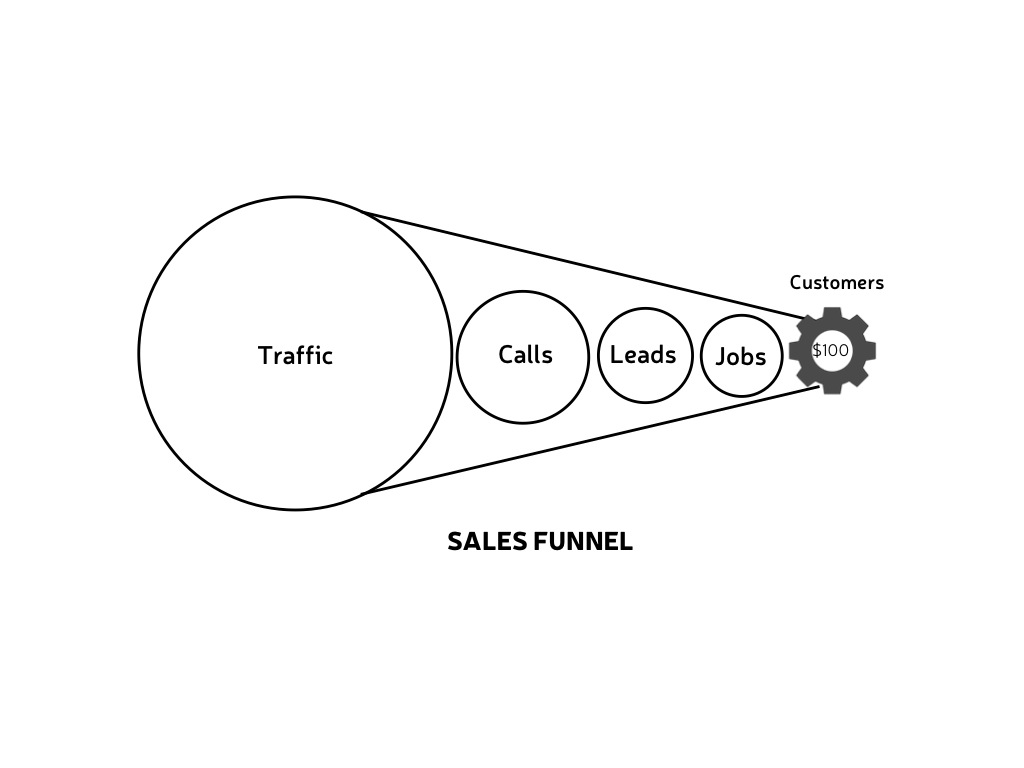
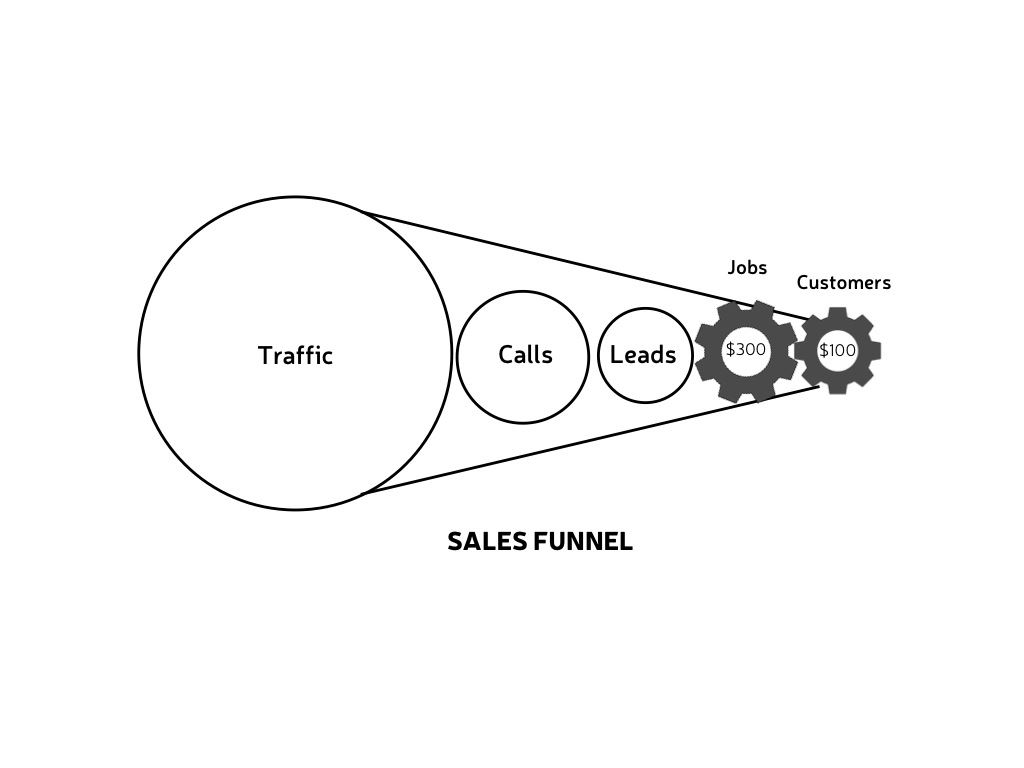
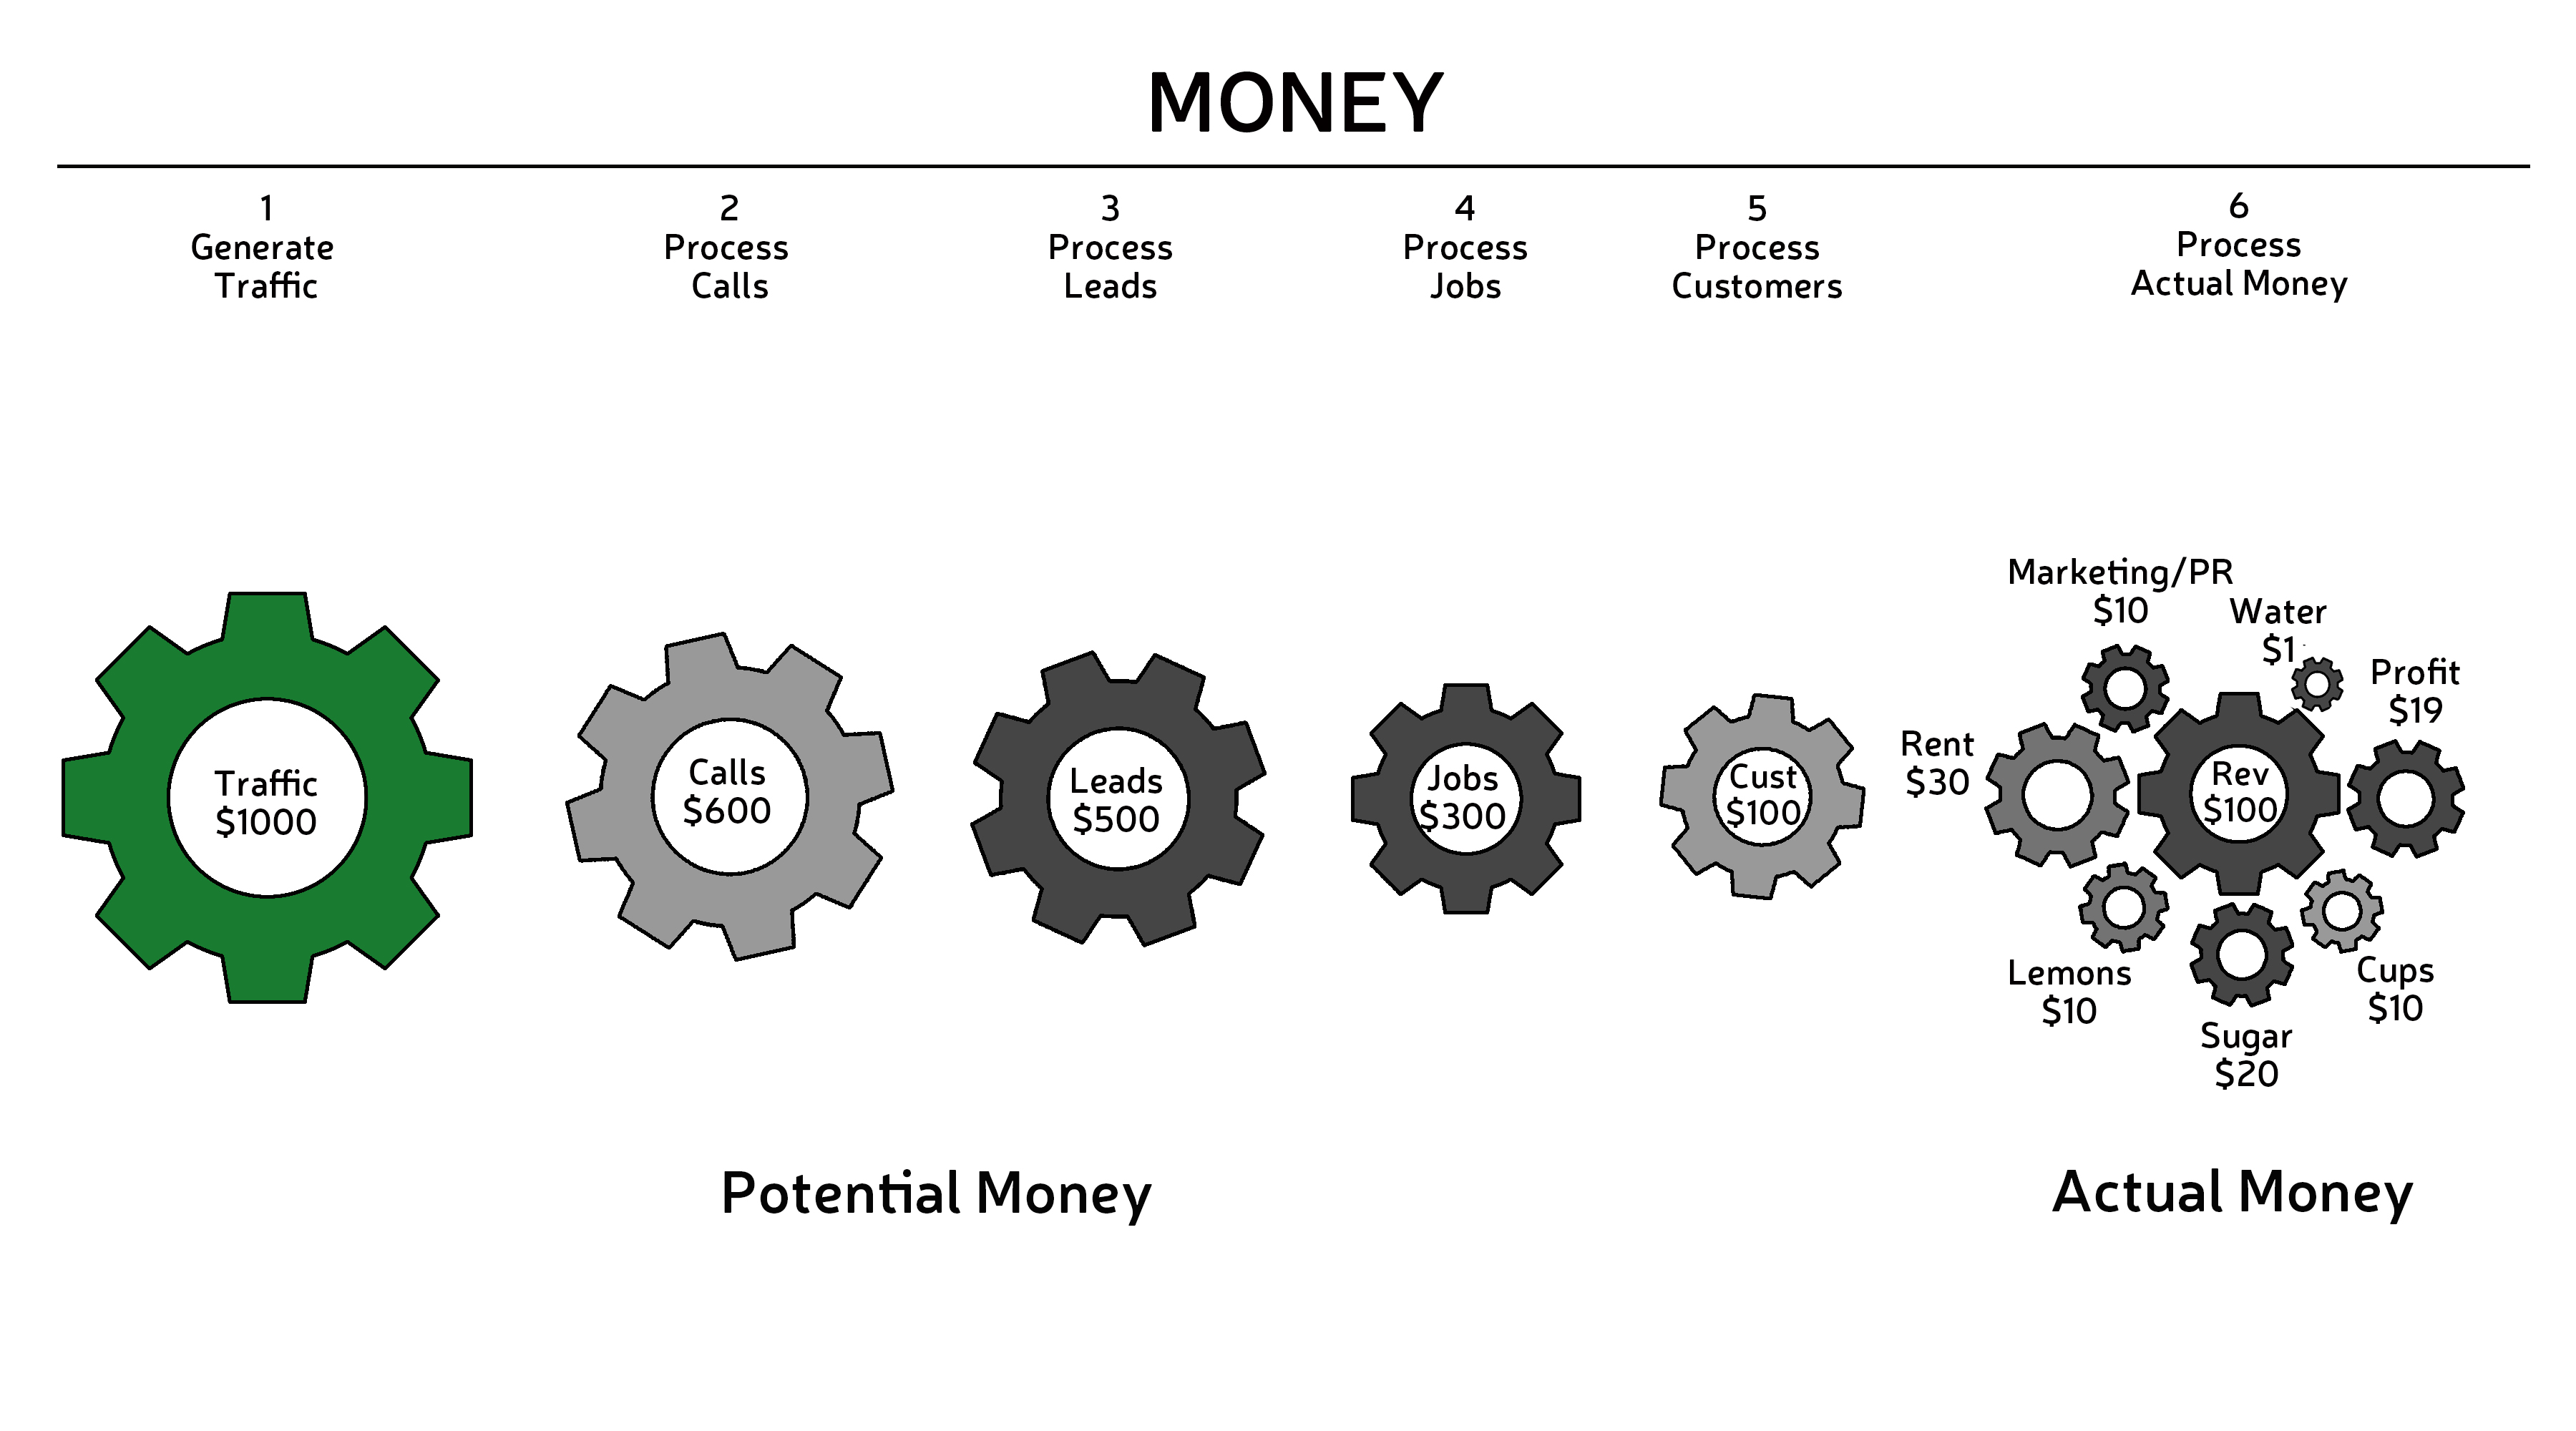
Now let’s make our sales funnel image specific to Lisa’s Lemonade stand and attach a monetary value to each circle.
In order to generate more than 19% in profit, Lisa calculates that she will need to sell lemonade to 100 Customers. The 100 Customers are worth 100 X $1 (per cup), or $100.
Lisa is a nice person. She decides that she will give away 200 cups of lemonade for every 100 cups she sells per Job. The 300 Jobs is worth $300.
Lisa calculates that she needs 500 thirsty Leads to walk by her lemonade stand in order to give away 200 cups of lemonade and sell 100 cups. The 500 leads is worth $500, but not everyone is thirsty and some people don’t like lemonade, so she will not be able to sell or give it away to everyone.
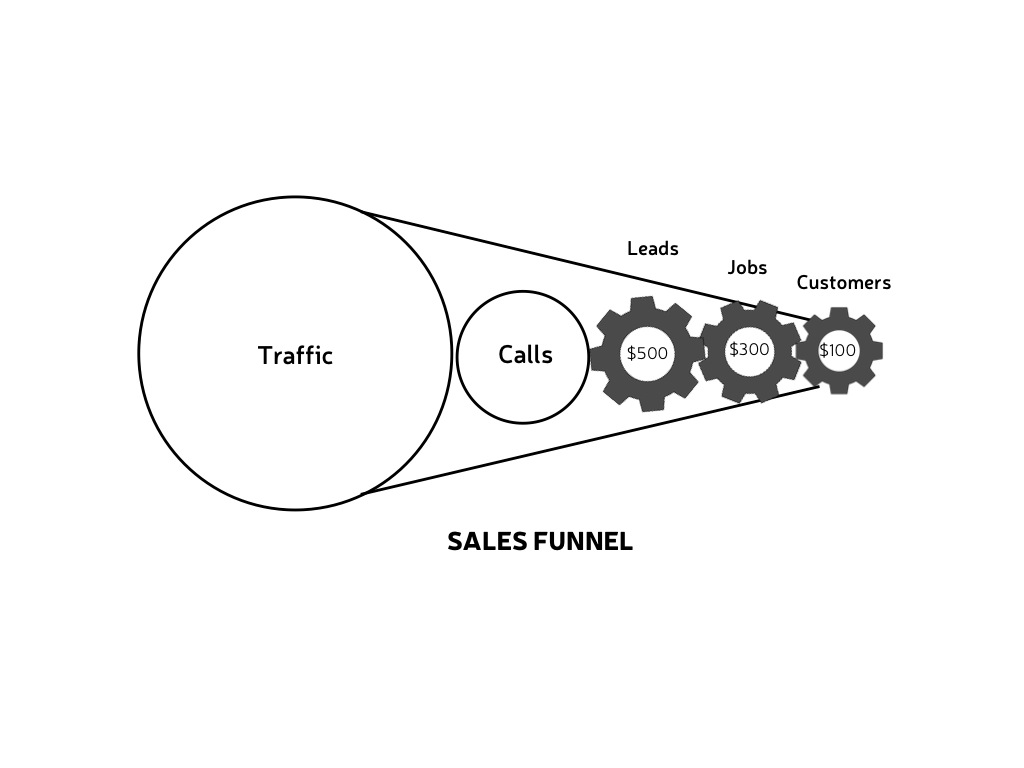
Lisa needs 600 people to Call on her business. These people actually visit the lemonade stand. Out of the 600 people, only 500 are thirsty. The Calls are worth $600.
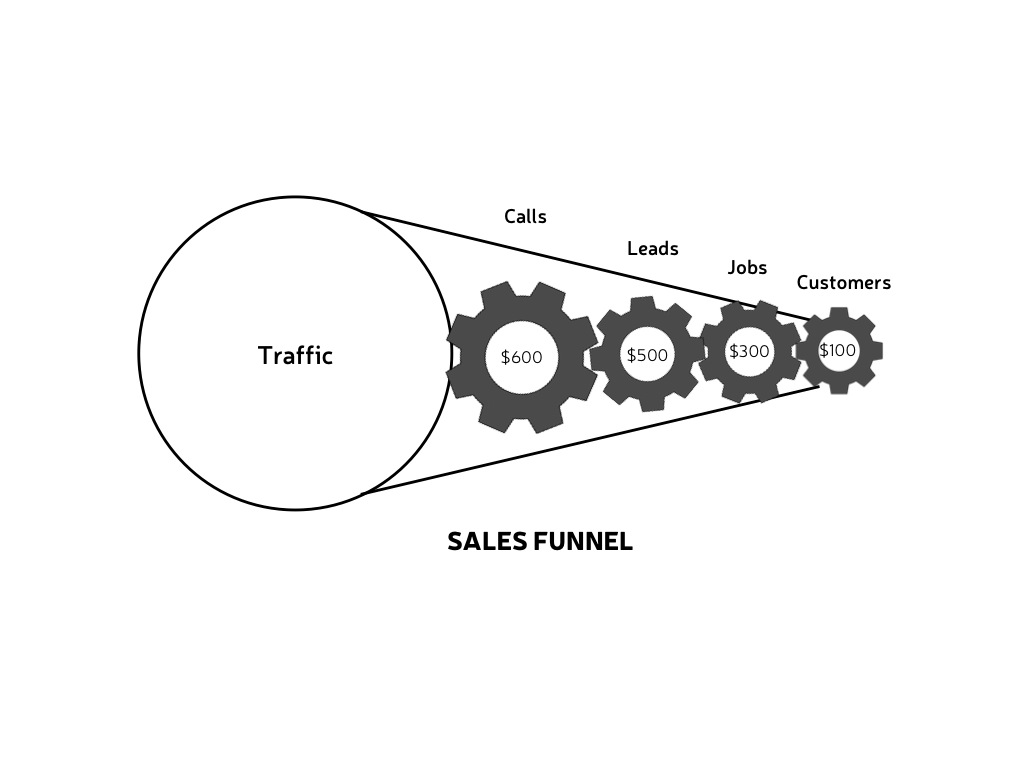
Lisa needs 1000 people to hear about her lemonade stand or see her advertising. This will result in 600 people Calling on her business. The Traffic is worth $1,000.
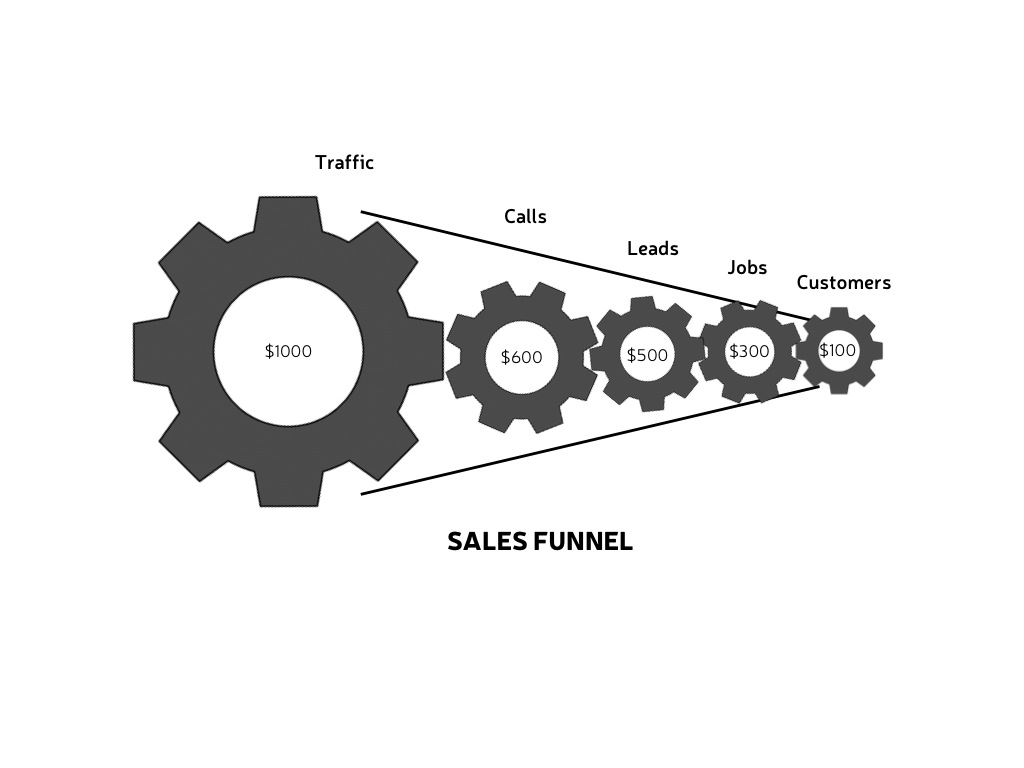
The sales funnel shows the descending value of the money as it is converted from traffic to paying customers. As with the ACTUAL costs, those values are represented by gears sized according to percentages (in this case, of the starting value.) The model is to scale, based on “how much” money is present in each sequence of work.
THEORETICAL MONEY
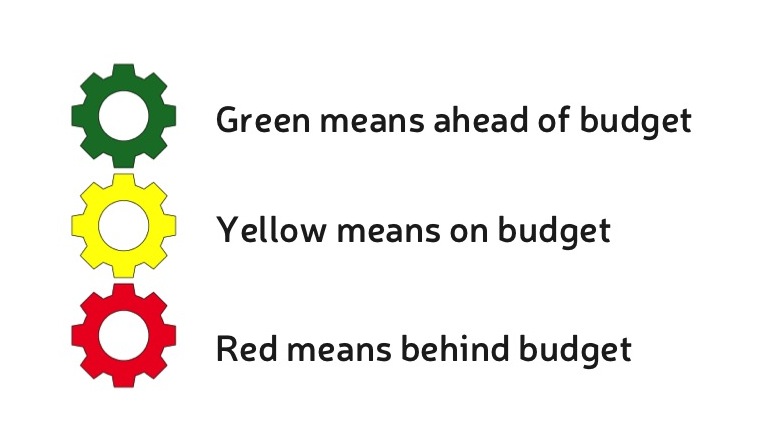
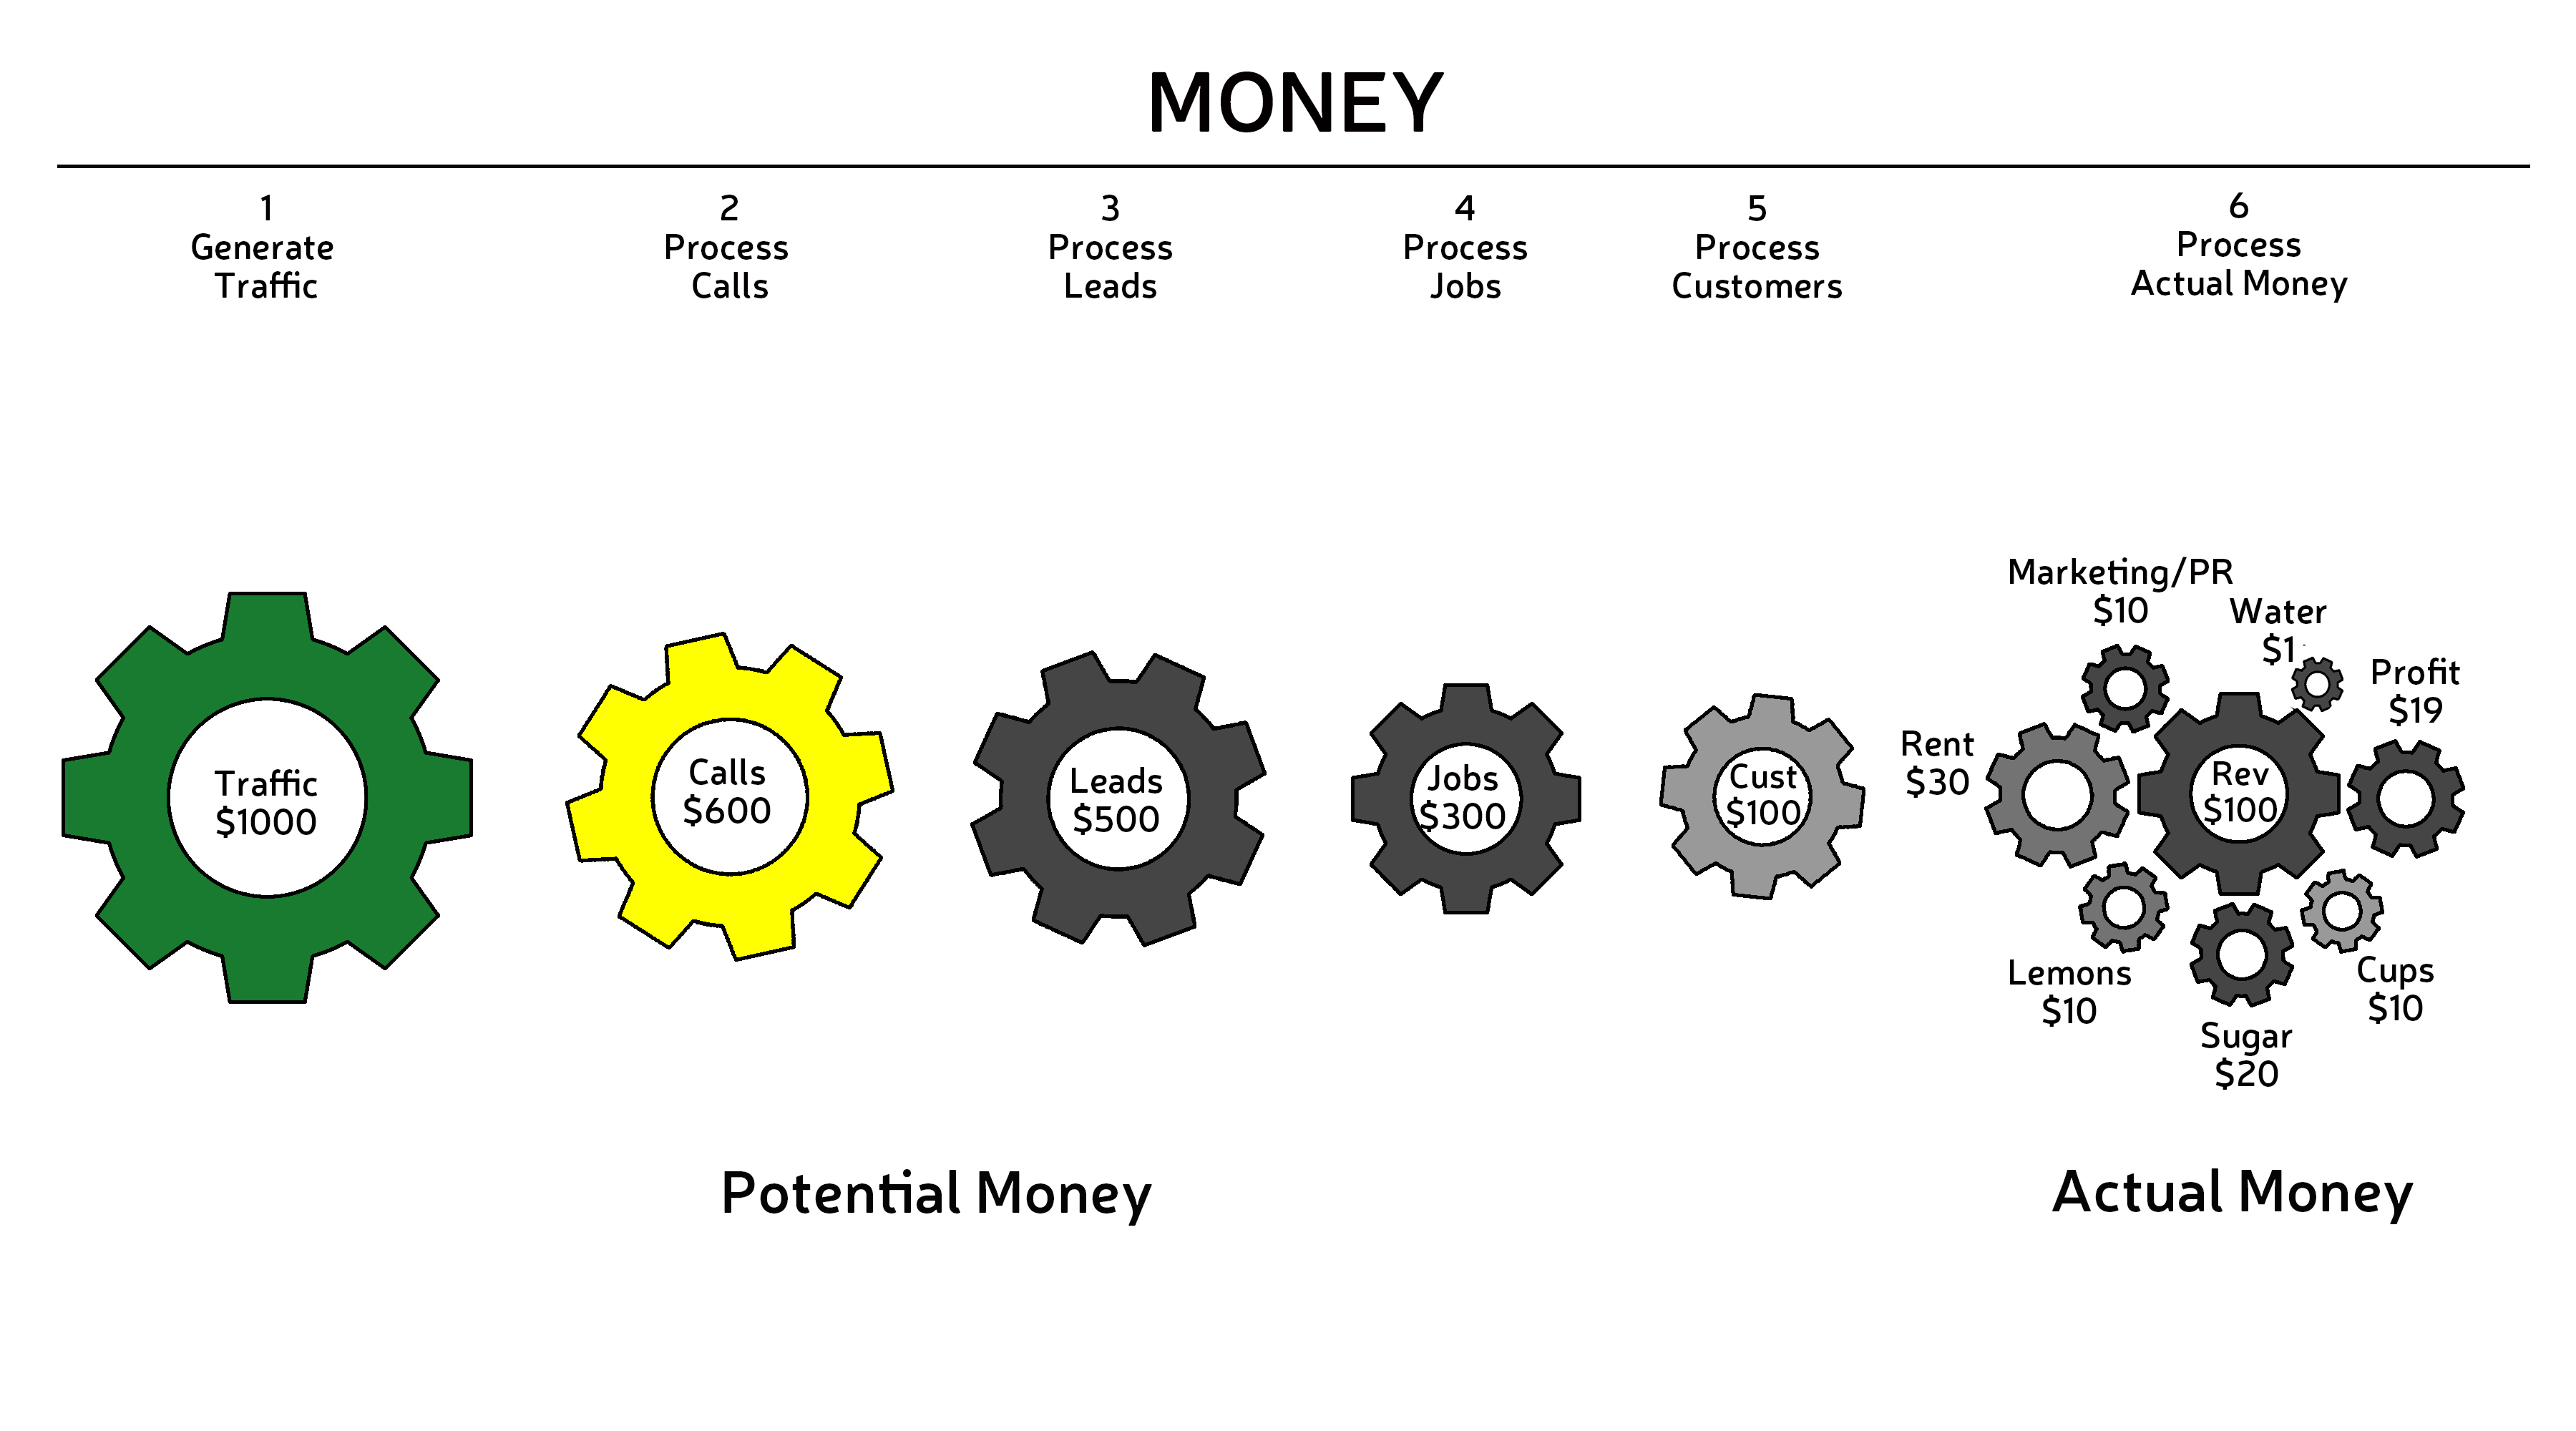
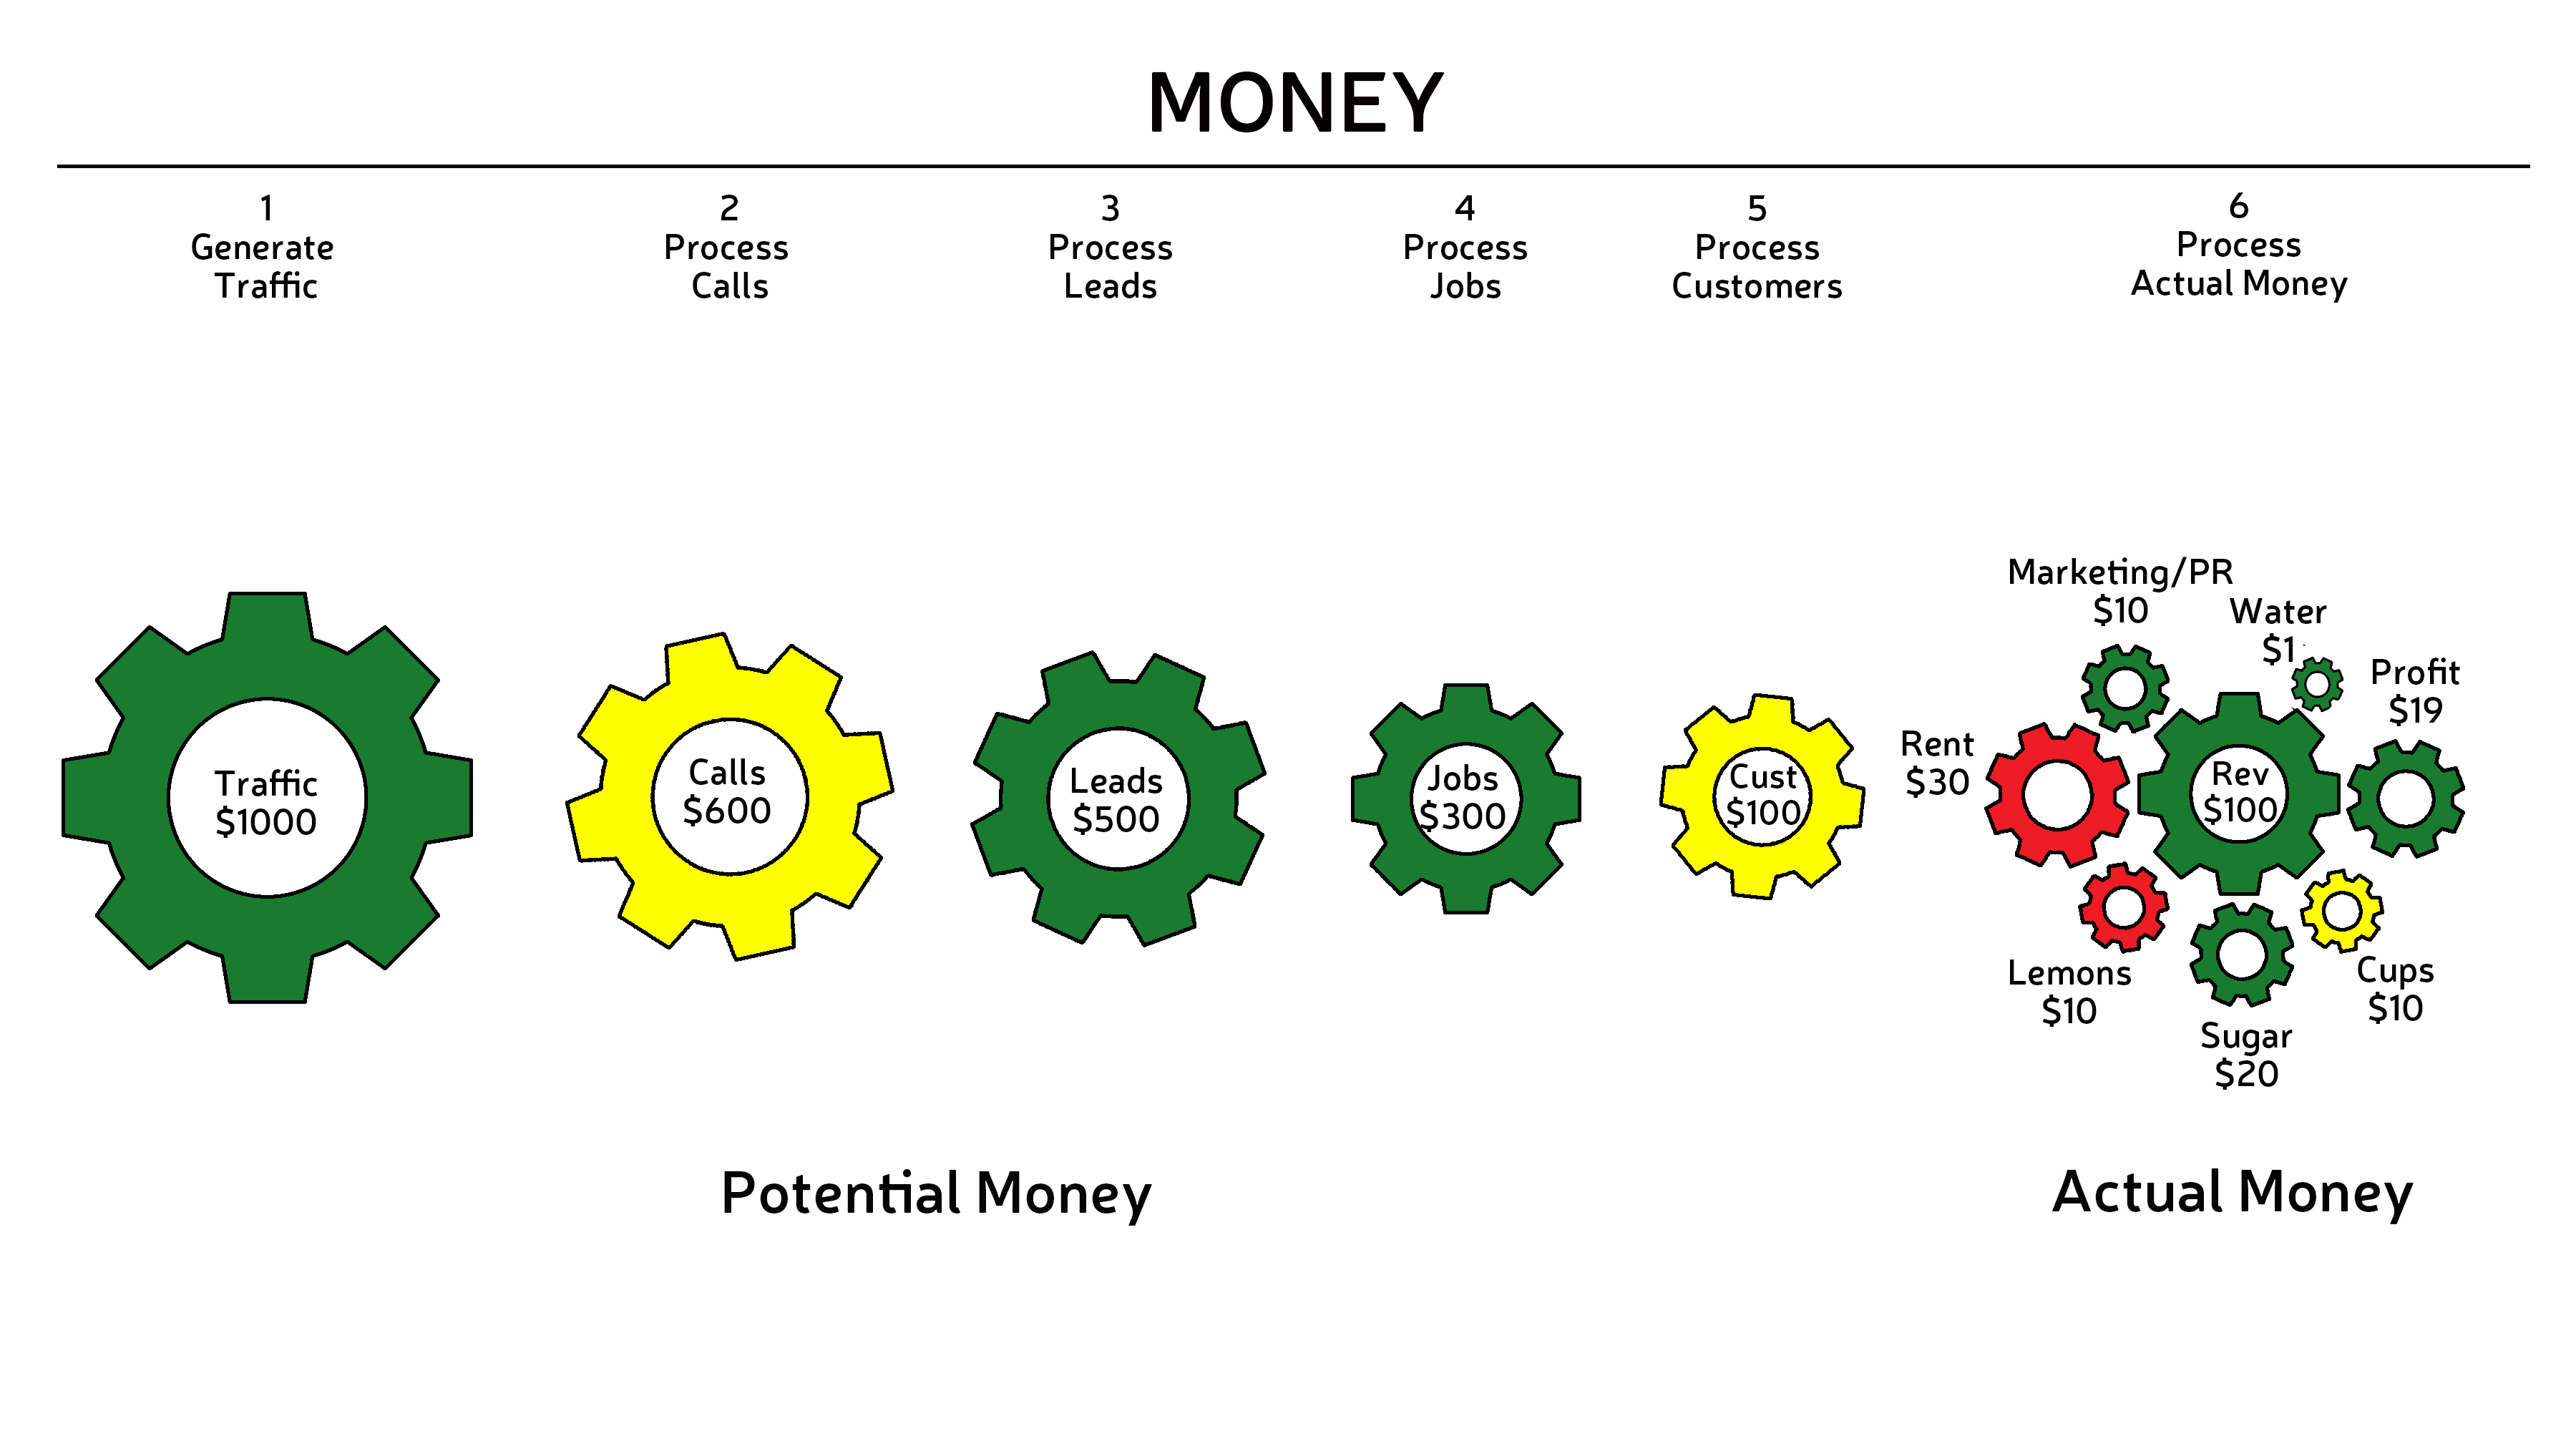
Lisa’s THEORETICAL MONEY is seen on the budget and is at play across both potential and actual money models. Visually, we will represent it using colors.
She generates more that $1,000 worth of Traffic with her Marketing/PR campaign. The gear that represents that cost is Green.
 She converted the requisite number of people from Traffic to Calls; so the Calls gear is Yellow.
 She had more than 500 Leads for the day; so the Leads gear is Green.
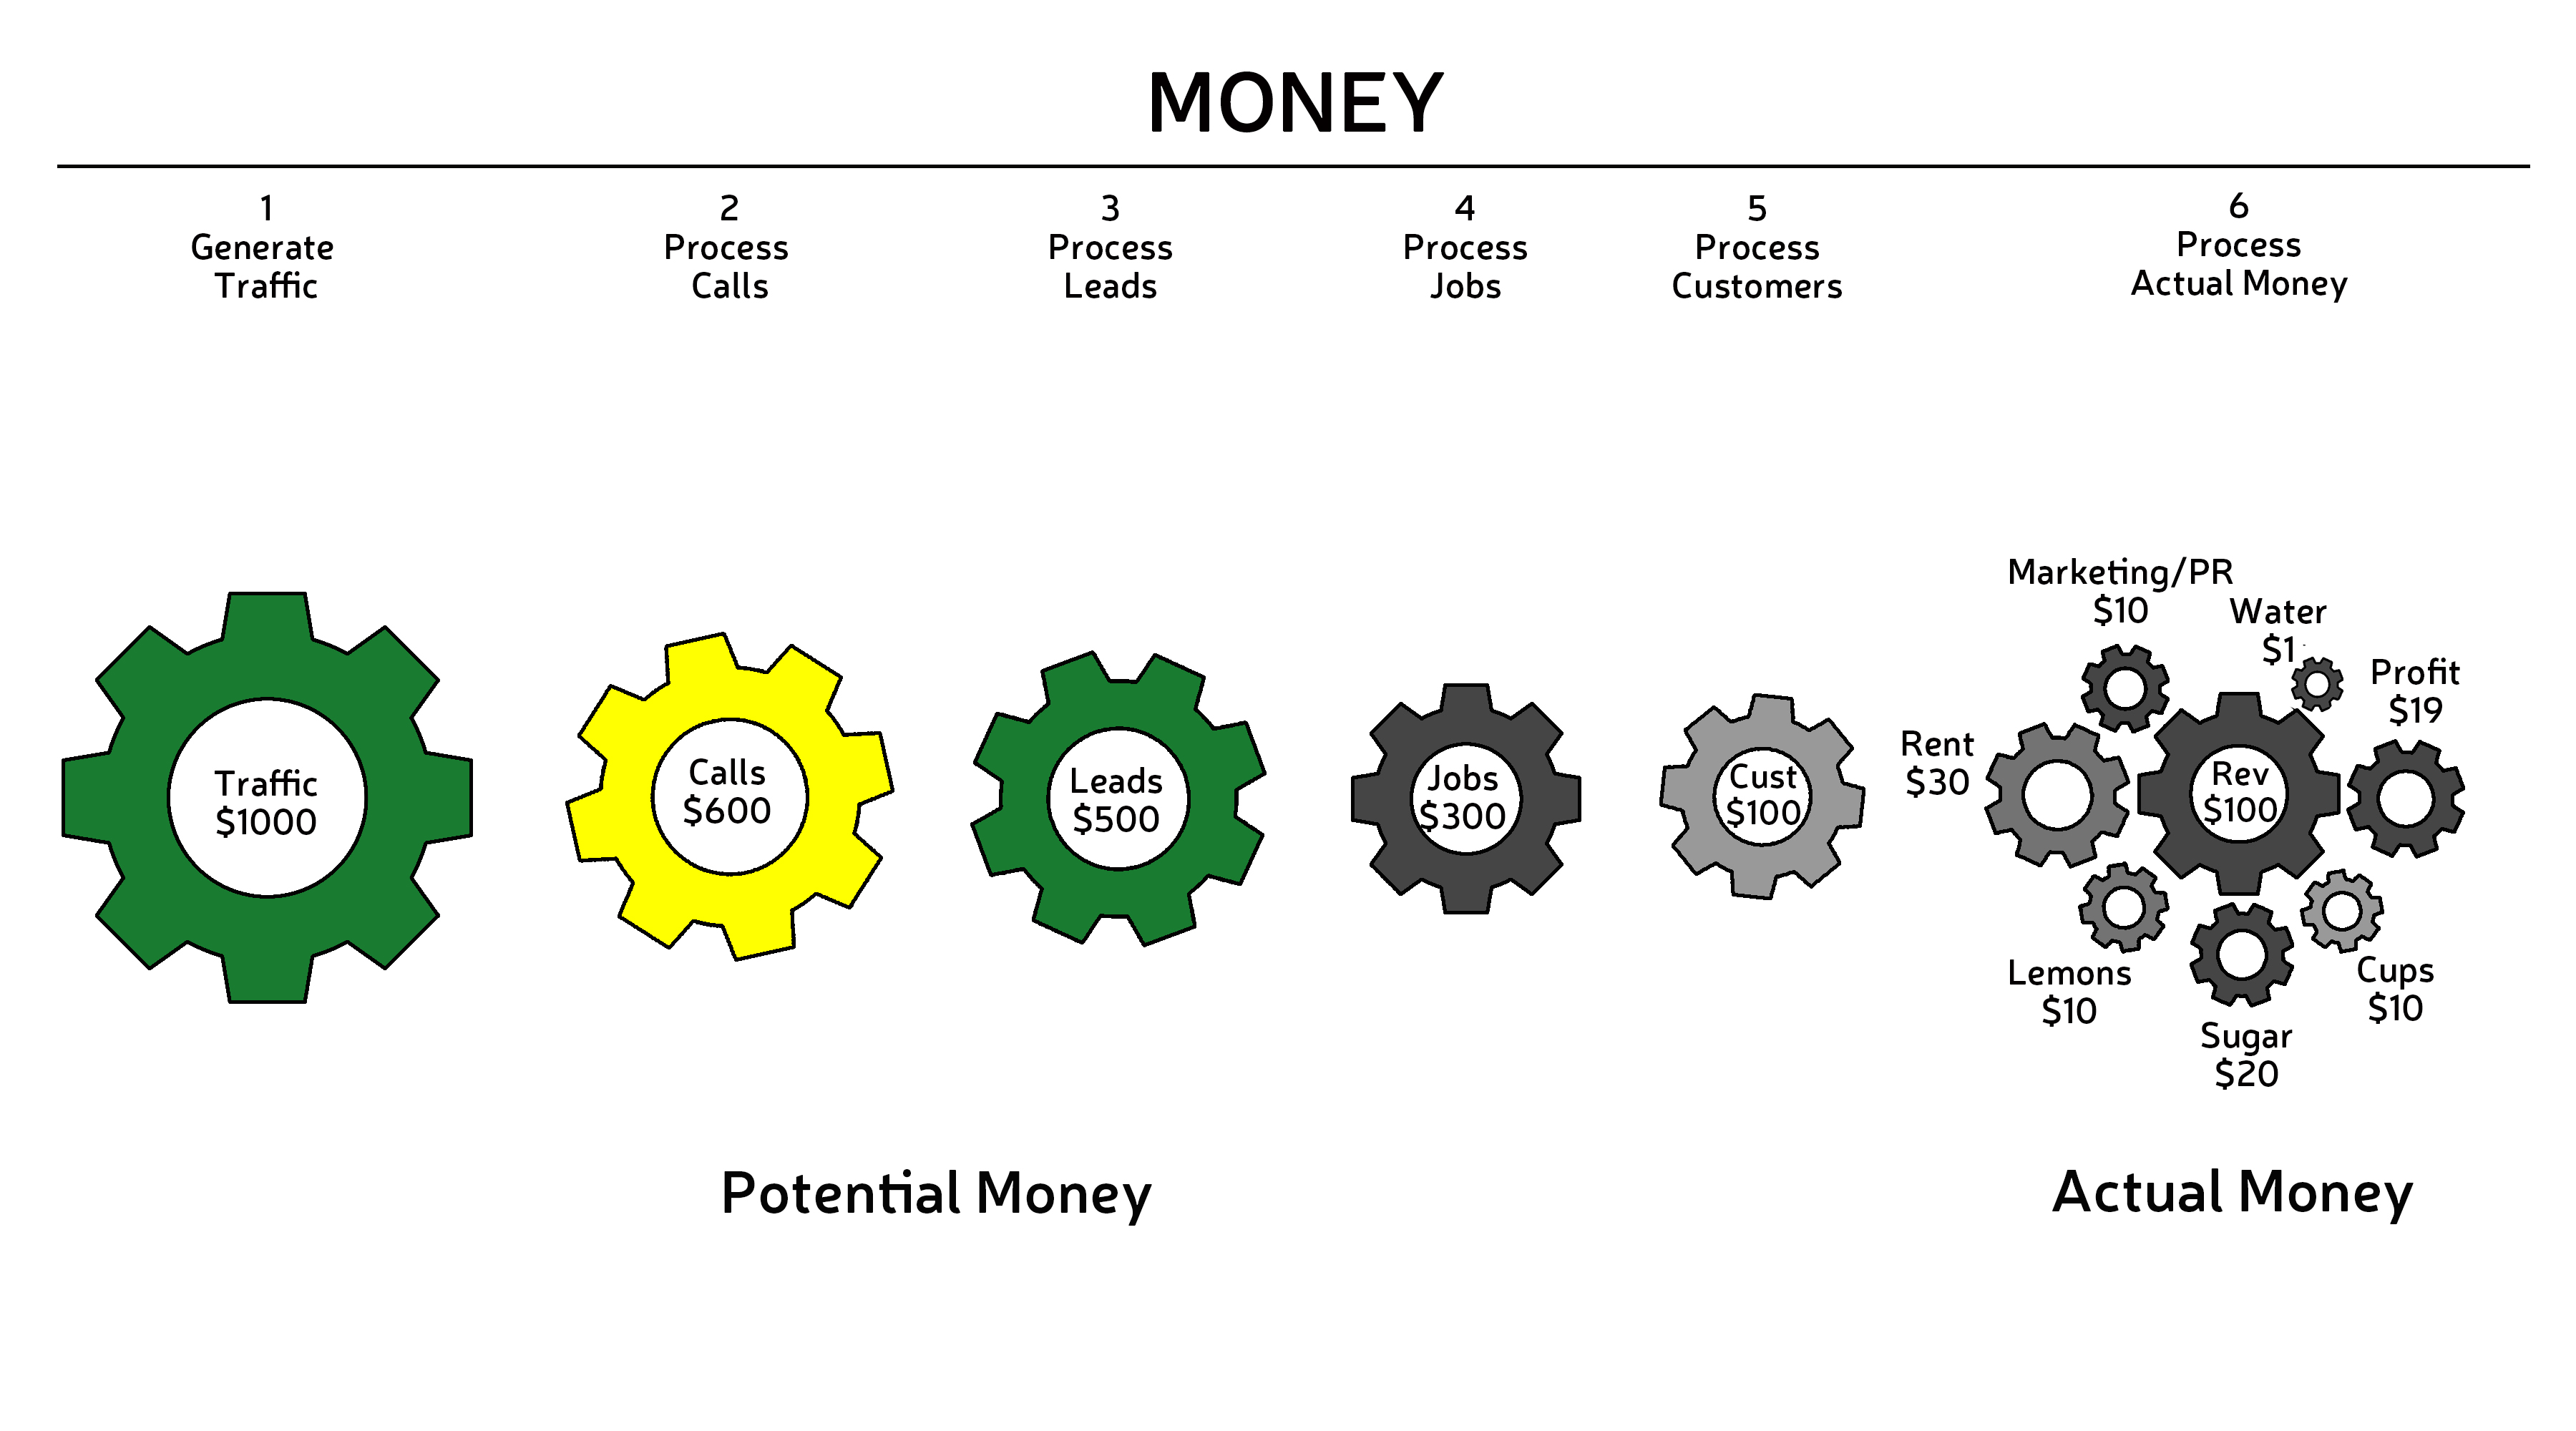 She poured more than 300 Jobs in the day; so the Jobs gear is Green.
 She had exactly 100 Customers for the day; so the Customers gear is Yellow.
 Her rent went up to $35 per day; so the Rent gear is Red.
 She didn’t buy in bulk, so she spent too much on Lemons. The Lemons gear is Red.
 You get the picture.
In the end, Lisa made more than $19 in Profit on $100 in Sales. She should be happy. But…she should also renegotiate the Rent and buy Lemons at Costco tomorrow. Then she’ll really be optimizing Profit!
 We want our model to show us 1) how money is being used, 2) how much money is being processed, 3) where money is being processed, and 4) when money is being processed. In Lisa’s visual business model, all it takes is a quick glance to see how things look.
- In Business Visualization, gears represent money.
- Actual money includes costs, revenue, and profit and correlates to income statements. The scale of gears in a Money Model is based on the size of the revenue gear.
- Potential money is comprised of money in the sales funnel, which includes traffic, calls, leads, jobs, customers. The size of the customer gear is always equal to the size of the revenue gear, i.e. the ratio is always 1:1.
- Theoretical money is associated with a business’s budget. It is represented in Business Visualization by color. Green is ahead of budget, yellow is on budget, red is under budget.
In the next section you will learn how to create your own scale model of the money in a business.