METRICS ARE A FORM OF INFORMATION
With energy (a.k.a money) covered, we turn the focus to that other fundament of our schematic: Information.
In an energy and information system, the technical definition of information is just that—technical. Allow me to posit a less mind-bending explanation.
Imagine driving a brand new car for the first time. Feels pretty good, right? Now imagine that the air in your tires is running low. The car still drives okay, but it’s not optimal. Let’s take it a step further. While driving on the highway through a flash rainstorm you discover that your windshield wipers aren’t functioning. How good does that quality automobile feel now?
Your car is a system and every time something within it changes, you receive new information that allows you to assess how well—or poorly—the system is functioning. The new car was working great. But when the rainstorm came: not so much. Information works the same way in your business system.
Metrics, remember, are the equivalent of information. That is to say, metrics are measurements that provide information about your business’s performance.

In the previous unit, we learned to construct a visual model using gears to represent the flow of money through the system. That model was primarily concerned with quantity. It helped us answer the question: How much? In this unit, we look at what’s happening between the gears to answer the question: “How well”?
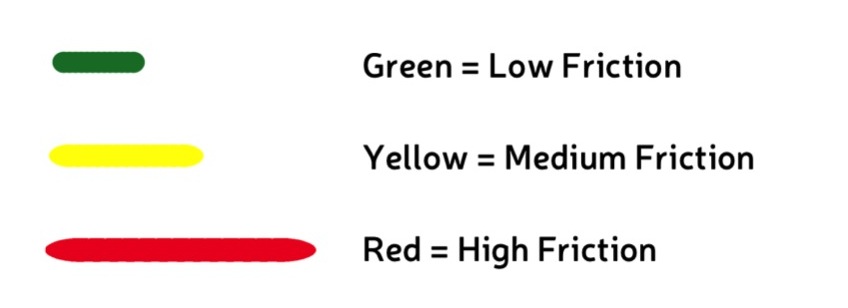
This time, we’re going to construct a visual model using lines of different colors and lengths to represent our metrics. The result will show immediately how your business is performing. Short green lines indicate high quality, medium length yellow lines indicate acceptable quality, and long red lines mean poor quality.
Red lines are the ones to look out for. They show where your business is having engine trouble. This trouble is best described in terms of “friction.”
In a physical system, like a car engine, friction points produce heat. Over time, this heat causes breakdowns. The engine isn’t humming optimally, and it loses energy. Friction has the same effect on business. Anywhere your metrics are lower than is expected or acceptable, you’ll find friction. Identifying and reducing these hot spots is key. You can’t have a well-oiled machine if you can’t find the squeaky wheels.
- Information in a system allows you to assess how well the system is performing.
- Metrics are measurements that provide information about the quality of a business’s performance.
- In Business Visualization, metrics are represented by lines of different lengths colored green, yellow, and red.
- Red indicates where there is friction in a system, i.e. where is not performed at it’s best.
In the next section you will learn how to model metrics for a business in order to spot areas of high friction.