SEEING THE BIG PICTURE
As business owners, we face a major challenge: figuring out how to keep track of all the pieces we’ve been talking about—tasks, jobs, processes, functions, money, people, and time.
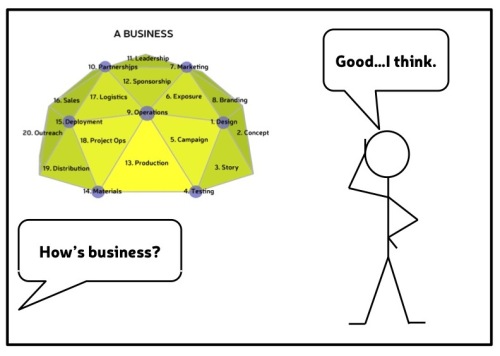
Many very smart people respond to this challenge by creating weekly reports for weekly meetings to assess the state of their business. Not a bad idea. Unfortunately, a “dashboard” doesn’t allow you to see the system as a whole. It also fails to account for change. It’s just a snapshot of one specific point in time. It’s like taking a single frame of a movie and trying to determine the plot.
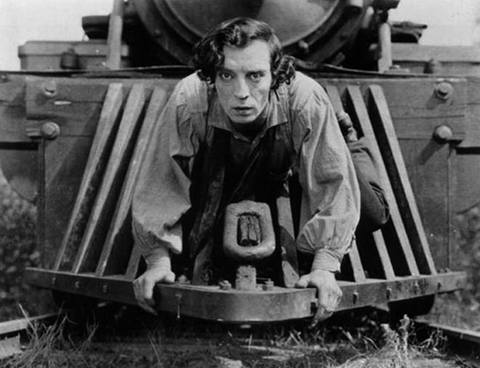
Film still from The General (1926).
All businesses experience change over time, whether we want them to or not. Walk into any workplace five years after your first visit and you’d inevitably see new faces or old faces in new positions. Check the ledgers and you’d certainly see numbers going up and down at various points. My 1-800-GOTJUNK? franchise looked a lot different in June of 2008 than it did in November.
To really understand your business, then, you need to be able to see not only what has happened at each fixed point, but also what is happening now and how things are changing over time. You need more than a still frame; you need a real time movie.
It’s a tricky problem. But this is where the fun begins…
Through visualization, I’ve figured out a way to take my fixed, static model of functions and apply the inconsistent and changing elements of time, money, and people to it. The result is a dynamic, scale model of a business, a way to finally keep track of all the pieces simultaneously. Being able to see this big picture allows me to identify where things are running smoothly so that I can keep those things going. It also helps me spot where things are going wrong, so I can give them a tune up. With this model, I can make changes on the fly and see how those changes affect my business as a whole, in real time. In short, through visualization I’m able to achieve a more efficient, more productive, more profitable business with less work in less time.
The first time I fully understood the business potential of my ability to visualize processes was in 1996, when I was working in IT for Andersen Consulting (now Accenture) in Baltimore. My job was to assist in large data conversion projects.
On one occasion, a team was in a panic because they needed the data converted in less than 72 hours. We had to run 132 programs in a specific order; there were internal dependencies between the programs; and there was tons of data. It was complicated. I knew nothing about the software, mainframes, or data conversion, yet I was able to imagine the flow of data through the system and then optimize the system in my imagination. In one day, I improved the conversion speed from 240 hours to 10 hours of elapsed time.
My boss gave me an award and a trip to the beach. She asked me how I figured out the optimal flow. I told her, “I saw it in my mind’s eye.”
FOCUS ON PRODUCTION
Creating a scale model of an entire business is a tall order. And frankly, without a software system or a brain that works like one, not everyone will be able to do it. Luckily, one of the main components in the business system—the Production Process—is easy to visualize in this way. Anyone can do it. And I’m going to show you how.
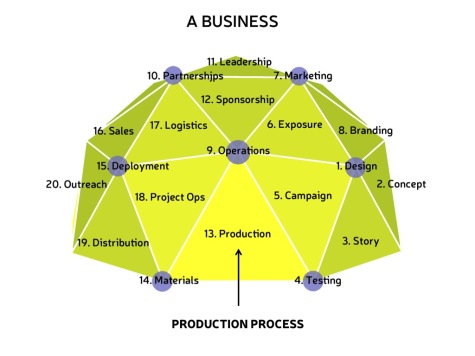
Earlier, I introduced the metaphor of business as a car. As complex machines, both businesses and cars are comprised of multiple simple machines. In the car, chief among these is the engine. In your business, Production (#13) is the equivalent of the engine. This is the heart of your business, where income is generated and circulated.
In the next sections, we’ll look at how the engine of your business works. I’ll guide you through creating a dynamic, scale model of your own business engine, and then I’ll share some advice on how to optimize it so it runs like a well-oiled machine.
- To really understand your business, you need to be able to see what is happening now and how things are changing over time.
- Business Visualization models offer more than a snapshot of a moment in your business; they allow you to see things as they evolve.
- The easiest way to visualize your business is to focus on the core piece—your production process.
In the next section you will learn about what energy and information systems are and why your business is an example of one.