As a child, I figured out how to model things in my imagination. I understood how to map information into visual objects, and organize those objects into color-coded patterns. I got pretty good at it. This modeling and mapping happens in a very organized place in my imagination. I secretly called this place “The Rabbit Hole”.
The Rabbit Hole isn’t connected to any words and that’s why it is so hard for me to describe it using words. All of the models in my imagination exist without any words at all. If I can’t imagine something in this visual way, I don’t really understand it. I can fake it by memorizing stuff, but that’s not the same thing as understanding something.
The Rabbit Hole seems to be completely disconnected from the part of my mind that processes verbal and written language, but it does have a spatial language. There’s also a very strong sense of time and timing in The Rabbit Hole. I can speed up and slow down simple models. I can zoom in and zoom out. Everything maintains a sense of scale.
I realize that this might all seem very odd to someone who doesn’t think the way I do, but as a parallel metaphor, imagine that we are talking about music, rather than spatial models. The ability to imagine and write down music isn’t unusual at all. Lots of people can imagine music and then write it down. I can’t see music in my imagination, but I can see systems that look like visual music. So, if you believe that it is possible to write down music, you must believe that it is possible to write down visual music. Systems are like visual music to me.
As I got older, I continued to use my visualization skills, applying them successfully to my work in business. Now, more than ever, I wanted to be able to describe what I saw in my imagination. I knew that if I could explain it to others, they would be able to see their businesses differently…and better too.
The only thing I had to do was to find a way to break a spatial model of the energy and information system that represents how the Production Process works. It was right in front of me, deep down The Rabbit Hole. But I couldn’t find the right words. The problem is that energy and information systems are dynamic – they are in motion. Things that are in motion are hard to explain without math, and I’m terrible at math. The inability to explain gnawed at me.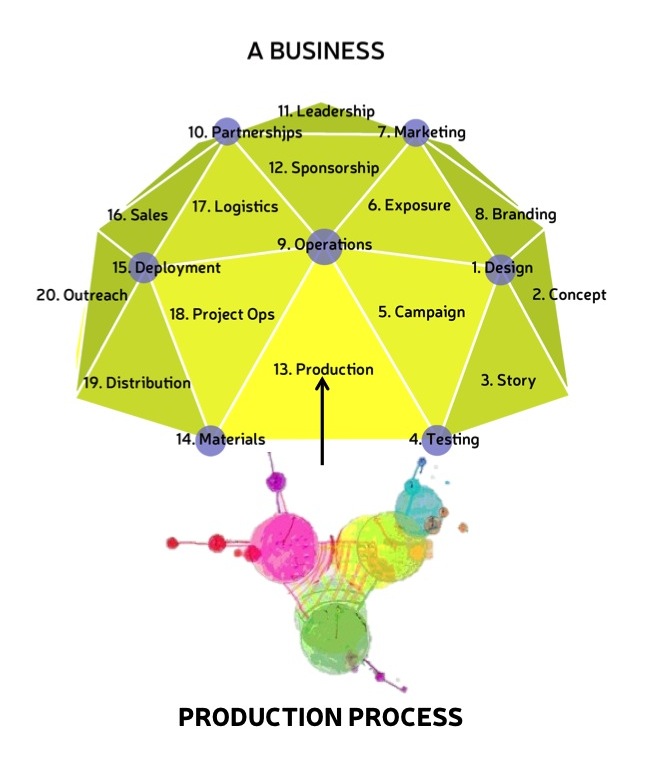 Then, finally, in October of 2007, I had an epiphany. I dove down into the Rabbit Hole and hit the model that represents the energy and information system that maps the Production Process in a business with everything I had. The works.

There is no symmetry in an energy and information system, so I couldn’t simplify anything. I had to do it the hard way. The only way I could find to do it was to break it down into lots of little piece and then reassemble the pieces outside The Rabbit Hole.
In my imagination, I placed a grid that was 100×100 over the model. Then I mapped out each piece individually. This was very hard to do and it took me eight days. I had to start over a few times because I couldn’t maintain the timing and this caused me to lose my place. I knew that each piece of the system was made up of energy, information, rules, or nothing. Since energy moves in a rotational direction, information moves in a linear direction, and the rules connect the energy to the information, I could keep track of what I was mapping.
Energy goes to the left. Information goes to the right. Rules go in the middle. If the grid had “nothing”, I could skip it. Next sequence.
Repeat. Repeat. Repeat. Repeat. Repeat.
Here’s the model with the grid overlay. The direction of the arrows depict which way the energy, information, and rules are moving.
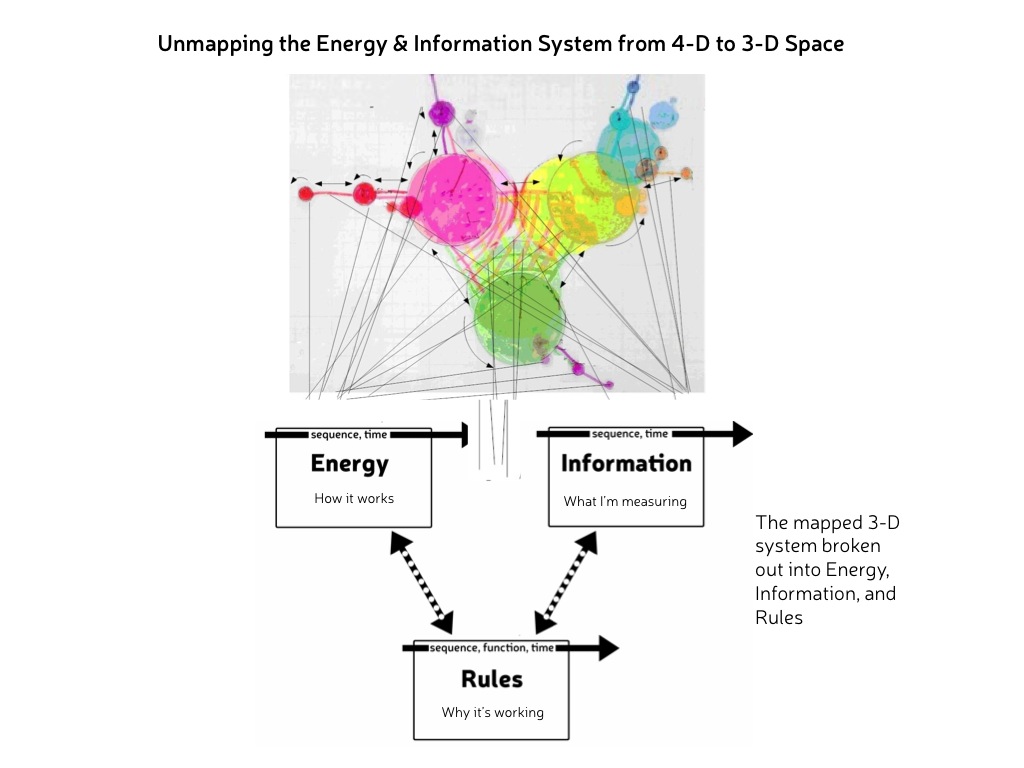 When I got to the final sequence, I knew I had it. The energy structure is on the left. The information structure on the right. The rules that connect the energy to the information are in the middle.
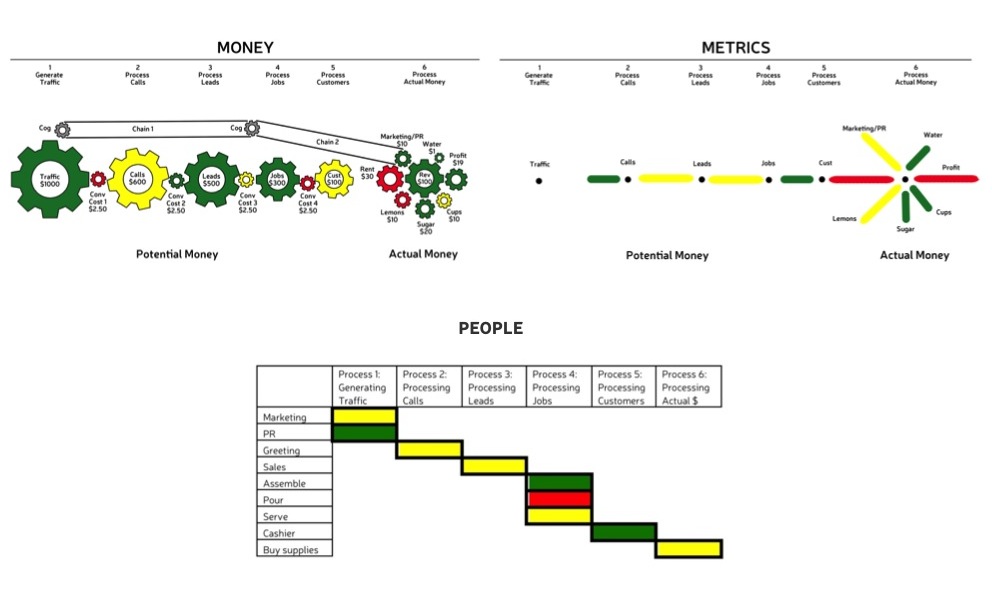
In other words, the money and metrics in the Production Process in a business system are a function of the performance of the people doing the work. They are all connected by sequence (the order that things happen), function (business function), and time. This visualization maps the entire system because it shows: who is doing the work, where the work is happening, what is happening, when it is happening, why it is happening, how it is happening, and how much is happening.
And that’s how I converted a model of an energy and information system into something I can describe.
I always wanted to explain how I see systems working. And now, I can.
Hey Rabbit Hole…I won.